Forensic Analysis of ReFS Journaling

Hello, I am Seonho Lee from the Affiliated Institute of ETRI. Today, I talk about the forensic analysis of ReFS Journaling.

Before everything, let me just briefly explain the two key topics of the presentation. I’m going to explain what is ReFS Journaling, and then present how to analyse the ReFS Journal files. Also, I’m going to show you the analysis process that was carried out for the development of our ReFS Journaling forensic tools.

The motivation of this talk is like this. When our research team analysed ReFS repository, I found the signature and log. I guessed that the signature is something like the record signature of the NTFS log file because ReFS is also developed by Microsoft. I expected that the logging concept of NTFS is similar to that of ReFS, and the journal analysis for a Logfile and USN Journal is the most [indecipherable] for NTFS forensics. Therefore, I thought it would be a great help to forensic investigator if the ReFS Journaling is analysed. So, we explore ReFS Journaling and this talk is about the result of the research.

Our research is meaningful in that we confirm the existence and the structure of the Logfile and Change Journal. They can be used as forensic artefacts in ReFS volumes. And based on the analysis result, I developed an open-source tool to analyse the ReFS Journaling files.

We reverse engineered the ReFS parse system driver and ReFS util to understand the internal structure of ReFS. You can see that the ReFS parse system driver has two parts: one for ReFS version one. In other words, there is a big difference between ReFS version one and version three, which will be explained in detail later.

Other things we identified while analysing ReFS refer to driver files, ReFS util system files and event messages. The data structure of ReFS is already known from previous studies, therefore the ReFS data source shown we have been described briefly as necessary to understand journaling.

ReFS use pages to allocate the data. Every page consist of a header and table. The header contains the signature address and object ID for the page. A table is a structure for storing data on a page. Tables store data using a row structure inside. ReFS version three and version one are so different that driver files are developed separately. The changes we were notice the newly added Container Table and Logfile Information Table to the metadata file from ReFS version three.

Of course the rest of the metadata parts also changes slightly in the data structure, but their logs are not very different. We will cover the Logfile Information Table later, and briefly introduce the metadata files necessary to understanding the Logfile. First, Object ID Table stores object ID and location of all directories in the ReFS volume. Therefore, to get directory information to object ID you need to refer to the Object ID Table.

Next, Container Table is metadata file for ReFS new address system. To obtain the physical set information of a file in ReFS it is necessary to convert LCN value differently from NTFS. The conversion mechanism used at this time could be found by reverse engineering the address rate [indecipherable] function of ReFS user.

Lastly, the Parent Child Table is a metadata file that contains information about the parent-child relationship of a directory. The Parent Child Table can be used later to check the purpose of a specific file in the Logfile.

We confirmed the existence of the Change Journal in ReFS. The difference from NTFS USN journal is that they use USN Record Version 3, not Sparse File. Since the ReFS Change Journal files does not have a sparse function, data is recorded in the form of [indecipherable]. And unlike USN journal using record version two, Change Journal use USN record version three, which seems to be to use 16 bytes file and parse number, so fsutil you can create a Change Journal on ReFS volume and query its contents.

Okay, now it’s Logfile, our main research contents. Logfiles also exist in ReFS, however there are some different parts from NTFS. NTFS Logfiles record redo and undo operations, however ReFS only records redo operation and has a new record structure. And as the Logfile system is different, the opcodes that occurs in the Logfile are different.

The mechanism of ReFS Logfile is the record transition that occurs in the ReFS. When an event occurs in ReFS the related page is updated. When a page is updated it means that the row in the page is changing. At this time, the Logfile records information on the row to be changed.

For example, suppose a user create a file, then the log for the Create File will be inserted into the page of the directory. Usually the Create File name or timestamp is entered in the inserted row. In this situation, the inserted row is record in the Logfile. In other words, the name and timestamp of Create File are recorded in the Logfile. Thanks to this mechanism of the Logfile, we will be able to track users’ first behaviour in Logfile.

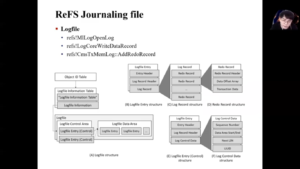
Then let’s look at the internal structure of the ReFS Logfile. The structure of the ReFS Logfile that I analysed is as shown in the figures here. I first analysed the LogFile Information Table among the metadata files that the Object ID Table has. Logfile Information Table contains location of Logfile, it is exactly the location of the Logfile Control Area. From the Logfile Control Area you can find the Logfile Data Area where the Logfile data is located.

Okay, Logfile Entry structure—here we can check the MLog Signature and everything. MLog, mentioned earlier in ‘motivation’, was the signature value of a Logfile entry. What we should be interested in Logfile entry is Log Record, not header.

This is the internal structure of Log Records. Log Records consist of three journaling records. These records store of code and transaction data that can identify which file system operation is. Let’s see this through on the example.

This example you can be seeing when being on this record with Hex Editor. The opcode appeared value is X1, which indicates that this record is data for an operation code Insert Row. Let’s look at which row was added where. If you look at transaction data you can see Object ID for the directory at first here. This means that the data that follow is applied to the Root Directory.

You can see that the key value below is the key value of the row to be added to the Root Directory. In other word, we can infer that an operation related to test that text file, especially an operation related to file creation, occurred in the Root Directory. By interpreting its redo record code like this, we will be able to trace the action that occurred in the ReFS volume.

We found out the meaning of opcode in redo record by analysing the PerformRedo function. Let’s see through IDA flow. Okay, in PerformRedo here, in this function you can see that the function code is different depending on variable 13. On the name of the function being called, variable 13 means the opcode and we can see what operation the opcode refers to.

The opcode and operation of a Redo Record are summarised in this table. We want to track fast file operation that a user did on a ReFS volume. So we conducted an experiment to identify which file operation was performed by analysing the opcode data appearing in several Redo Records. Through the experiment we were able to identify what behaviour the operation patterns appearing in Log Record means.

Log Record does not record the full path of the target file, therefore to obtain the entire path you need to refer to the Object ID Table and the Parent Child Table. For example, if Log Record knows that object ID is x704, you need to know what data in x704 is. Since the object ID is x704, you can find out the name of the directory by finding the log meta key value of x704 in the Object ID Table.

Suppose the directory was named Test Directory. Since Object ID is 0x704 is not the object ID value of the Root Directory, the Parent table data exists. Meta object ID of the Parent’s data or Test Directory ID is 0x600. In the Object ID Table it can be seen that x600 is the Root Directory. After all, we can identify the purpose of the file that we find in the Log Records through this process.

We had to decide which time value is in the Log Record or the time the event occurred. Fortunately, we are able to check the Redo Record where the timestamp of the file was recorded and transaction time could be specified through that timestamp.

We developed a tool that analysed our ReFS Change Journal and Logfile based on all the research result. The tool was developed in file system and given an ReFS image. It is a simple tool that parse and analyse the Change Journal and Logfile.

So, let’s show you how our tool analyses our ReFS journal files. First, to create our ReFS Image a virtual disk was created and formatted with ReFS. Okay, then use fsutil to enable Change Journal on this programme. Okay, and I will create a text file here, “Hello”. The filename will be DFRWS. Save. Now let’s try reading the ReFS volume with FTK Imager. Local Drive. Demo. Okay, let’s wait a minute.

Okay, open the ReFS Image with ARN. No. Okay, and click the ReFShell button to parse the entire file system. Okay, and you can check the Change Journal and Logfile. You can see the result for the Logfile and Change Journal like this and find the DFRWS text you just created. Okay, here, File Create. It is all to developed to analyse the Logfile and was developed to see how the entire operation occurred. Current cstory is developed close to the pure syllable so there may be problems that the ID did not expect, so please understand.

Finally, the conclusion to our study is that forensic analysis is required for ReFS journaling parse. When forensic analysis of our ReFS is visited in the future, the Change Journal and the Logfile introduced today will serve as important artefacts. Okay, that’s it for my presentation. Thank you for listening.

LogExtractor: Extracting Digital Evidence From Android Log Messages Via String & Taint Analysis

Hi, thanks for showing me. This is Christian Chao, a PhD from Iowa State University. Today, I’m going to present LogExtractor. This is joint work with Chen Shi and my advisor is professor Neil Zhenqiang Gong and professor Yong Guan. The project is cooperative with NIST researchers, Barbara Guttman and James Lyle and sponsored by NIST and csafe, Centre of Statistics and Application of Forensic Evidence. We propose LogExtractor as an automated approach for identifying and extracting digital evidence for Android Log Text Corpus.

Searching evidence in the Text Corpus is one of the most popular ways when forensic practitioners look into their mobile devices. According to R-Droid an Android app data flow analyzed a  study in 2016, by analyzing around 23,000 real world apps. If [inaudible] logging system is the primary place where apps save evidentiary data, such as GPS location, and network information. That is to say when a forensic analyst investigates the mobile device Log Message has the highest chance to contend the useful digital evidence. Here let’s work through this [inaudible] of evidence identification from logs.

First, the first investigator dumps the log from the suspect device by using tools such as Android Debug Bridge. Next, wastage tracks the Log messages, then investigate [inaudible] software to search by keyword or regular expression to locate and retrieve the evidence. Following the information introduced [inaudible], let’s take a look at this piece of Real World Log Message.

If you were for instance an analyst working on this, how and how fast would you find your evidence from the log message? Well, probably you can come up with techniques such as keyword searching or regular expression mappings. But let’s look at this closely again. Given that you’ll find these are GPS coordinates, by which patterns would you use to parse this information? And imagine if there are no keywords like location that show up. It will be more difficult to catch this part when dealing with the Real-World size Log Corpus, which is also more than 10,000 messages.

Let me use this example to rephrase and motivate our research problems. Given that a forensic investigator wants to find the evidence from Log Message A and B. Our first research problem, evidence identification problem, is to find which message contains the evidence, and if the answer is yes, what types of evidence they are. In this case, given that we find our message A contains that GPS latitude, what’s the actual value it’s supposed to be? Here the evidence extraction problem comes, which targets at answering this kind of question. Using the affirmation example from message A, let’s quickly go through the example to see how an ideal automation tool like LogExtractor should work for extracting the actual evidence on the Log Message body part, which is highlighted in orange. Later, we will repeat this example with more technical details. Given LogExtractor has to analyze this result as the State diagram in the center and Input String at the bottom left, we work on that state diagram based on the input corrector one by one, then I’ll put the result at the bottom right. So here we place an automation to see the result.

So as you can see, with such a state diagram, we can [inaudible] extract the latitude value which is 30.03 from the Input String. Our research purpose is to use LogExtractor to answer both evidence identification and extraction problems. We find that existing studies are limited at solving their specific domain problems, but cannot help us to solve evidence identification and extraction problems in Android Logging System. For example, the Android App can analyse studies such as FlowDroid and DroidSafe. As the right hand side figure demonstrated, we can only tell which type of data can be [inaudible] at which category of sync like the Files System. Unfortunately, they do not support the output as detailed as the Log Message String patterns. On the other hand, String analysis studies like JSA and Violist do support String pattern analysis, but do not answer which piece inside the String patterns carry which type of evidence.

Log parsers, unlike [inaudible] approaches, implement the analysis based on the data mining, which builds their analyst logic on historical data. However, while it does use techniques like Regular Expression to cash Frequent Use evidence, it still lacks the ability to answer evidence extraction problems without key workings or manual operations. Therefore, we propose LogExtractor for solving our research problems.

Before diving deep into the research details about how we build the automated extraction tool, I would like to give a quick review on Android Log Message. As the example shows, a Log Message is composed by Timestamp, the Process ID, the Test ID, Log Level, Log Tag and Body Message. Well, Timestamp, Process ID and the Task ID are determined by the run time and Android app can decide the Log Level, Tag, and Body by selecting the corresponding APIs and variables.

Here is our proposed [inaudible] with the help from LogExtractor. After the forensic investigator obtains the Log message from the suspect device, LogExtractor automatically identifies the evidentiary Log messages and extracts the evidence like a GPS location as shown in the example. So now the problem is, how to generate these kinds of patterns? So next we will present how we generate a pattern here for matching and extracting the evidence.

We propose to build App Log Evidence Database in the offline phase, by analyzing Real World Apps. Each entry in a database represents a Log Message pattern, including Log Level, the String patterns of Log Tag and Log Body. That may be retained [inaudible] during the wrong time. The log stream pattern is summarized as tainted DFA, which will be covered later. The workflow at the bottom demonstrates how we use this database to identify and match the evidence from Log messages.

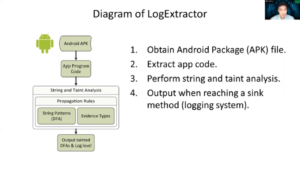
To build App Log Evidence Database, a part of the LogExtractor, we propose to apply a composition of String and Taint Analysis over Android App Program Code. That is, we analyze Android APK files collected from the Real World market, such as Google Play store. Then for each login and API that writes the log message, we output a log of message patterns. So here let’s use a program called [inaudible] sample to demonstrate this.

So first we initialize. So, as you can see another line too, we initialize a String constant, and we [inaudible]. So here we have the variable tracking the stream variable, ‘’Lat-’’. Then we propagated it into the stream buffer. So here is another variable with floating numbers, String pattern and carrying the latitude type. That’s your latitude with angle brackets [inaudible]. Then we combine them together and propagate the result to the output buffer. So that’s the overview. And now, before moving to the Tainted DFA let’s first look at the DFA.

So the DFA, Deterministic Finite-State Automaton,  is functionally equivalent to the record expressions like these two examples. When we match an input stream with the DFA, by working from a state to another state, one corrector is consumed from the input stream. At the end, if one can reach the end state denoted by the double circle such as S4 state and the input stream becomes empty, then we can conclude that they are a match.

This is the tainted DFA representing our previous example. So as you can see, the left hand side is the part for the constant stream, ‘’Lat-’’, and the right-hand side is the floating number string with evidence type, Latitude.

So beside the [inaudible], we add a Taint Table for each state within the DFA to check evidence-type provocation in the app program. In this example, any corrector being matched by the right hand side will be a part of the Latitude String Output.

So by using that Tainted DFA, we summarize that there are three scenarios when using the Tainted DFA to extract the evidence stream from the input. So no doubt that the evidence type is unnecessary to be a single type like the latitude that we previously demonstrated. This work can also support the case when the input string carries multiple evidence types, like a text input or the unique identifier. So to quit extracting the stream, we keep tracking two pointers, one point to the current state after consuming an input corrector while the other one points to the previous state. In this scenario, since we just move from a state without evidence to the one that has a certain evidence type, we initialize this output buffer.

And following the previous one, if both pointers point to states with the same evidence type, we should append the input corrector to the output. This arrow suggests that, as you can see here, the first one is the tainted one, and the next one is done when we saw the taint which means the first one has the evidence-type state, but then the following one doesn’t. So in this case, such as that the input corrector T3 shall not be counted as the evidence stream, and we should stop the buffering and output of the result. So, let’s wrap up the scenario that was introduced earlier and work through this example again. So this is the example that we, by analyzing the program code [inaudible] get this tented DFA.

So if you remember it, the left hand side is the Constant String and the right-hand side is the Floating String with the Evidence Type Latitude. And suppose we have an Input Stream like the bottom shows. So here, we start from the initial pointer. So next, from the S26 to S27, there is an uppercase L so that we consume, correct our L and move to the next date. And since these two states are just states without the evidence type, then this corrector should not be counted as any kind of evidence here.

And next is the A and T and hyphen. So we moved to the hyphen then, okay. This is the first scenario that we earlier proposed. So we moved from the state. We sell the evidence types to a state with the Latitude evidence type. So after consuming the hyphen corrector we’re supposed to initialize the output buffer, and you can see the edit button, right? Like this. Then we conjoin the number three and since it is not real that two states have the same evidence-type latitude, so number three should be counted as part of the Latitude [inaudible]. So we keep appending the output from the Input String until we reach the end state of this tainted DFA. And since you can see the infrastructure here is empty, which means we finish extraction and we can output this value as a result.

So we evaluated LogExtractor on both Benchmark Apps and Real World Apps. For Benchmark Apps, we used DroidBench. We count only the apps that write log-in messages. At the end we found there are 65 apps. As you can see the Identification Extraction Performance are quite well. There are some technical limitations that deteriorate the performance like ICC flow, it’s inter-component and communication between the different Android components. And we inherited this limitation by the tool we use for R-Droid to construct a co-graph. And also there are other limitations like the Implicit Flows that are well-known challenges in [inaudible]. And also since we linked precise stream models of Strava String Libraries, like the Formatter and Matchersome patterns around the wrongly constructed.

And the Real World App variations conducted over 12,000 apps. We manually verified 91 apps and got a similar performance report like the Benchmark apps. There are two additional limitations found in the Real World apps verification. One is the String Model Precision on two dimensional data structures, such as Map. And the other one is the Any String DFA, which for, by Any String, it means it’s a regular expression. You can imagine this as a regular expression that can step [inaudible] the String. So in this case if there are the API [inaudible] that we failed to buy a proper String model, then it will deteriorate the performance because then we keep the system consistent and treat it as an Any String model. And you can imagine that in this case, we will merge all evidence types together and offer the results. So in this case it will cause false reports.

And before concluding this study, I wish to use some Real World Log messages that were found in our manual verification to highlight LogExtractor contribution to our research problems. These are the Real World Log messages that carry a GPS location data. As you may find, the first one looks straightforward and can be easily followed, given the searching keywords are correctly used.

Next, we find a case where GPS coordinates appear as we solve the keyword. However, due to the separator and their appearance sequence, that latitude goes first, then longitude. We believe this may cause for an investigator [inaudible] but it is not impossible to find. So the most interesting one comes up here, the next one.

We also find a case where there’s no keyboard location like GPS, like latitude. There’s nothing there, but just a comma. And these are just comma-separated String. And coordinates order do not appear as the other generally used patterns like you always go with the latitude and then longitude. So in this case the LogExtractor reports that actually the first one is the longitude, then it goes with latitude. So we believe it is very challenging for a human investigator, as well as other existing forensic analysis tools to determine the correct GPS coordinates from the Log message. So, and here, this is how we introduced the LogExtractor to play the important role when being used to automatically extract the evidence from the text stream.

So to sum up our proposed framework, LogExtractor combines String and Taint analysis to build the App Log Evidence Database. With that database, we present how to match and extract the digital evidence from the Log Message, dumped from the suspect device. At the evaluation part, we demonstrate how LogExtractor can help with retrieving the Real World GPS Location  Evidence, which humans and [inaudible] are limited to catch. In the future, we aim to keep improving the time and space efficiency when applying LogExtractor on analyzing Real World Apps. Also, we will work on extending our existing industry analysis model by the one with higher precision. So thank you for joining this presentation, again.

PitchLake – a tar pit for scanners

by Simon Biles
Founder of Thinking Security Ltd., an Information Security and Risk Management consultancy firm based near Oxford in the UK.

We’ve had two bank holidays in a row here in the UK – first off for Easter, then for the Royal Wedding – time off work coupled with very pleasant weather and plenty of “refreshments” has caused my brain to atrophy! So, rather than pulling one of my usual type of topics from the hat for this article, I thought that I’d do a mini-project for the month.

[ I’ll apologise up front though – I can only just program in both Perl and C, and C isn’t exactly column friendly, so it’ll be Perl. I know that many readers here can program in Perl, and most of you probably better than me – I’d be interested to hear corrections, tips and tricks in the comments so as to improve, as no doubt there are better ways of doing this ! ]

One of my first tasks in the office this morning, after a cup of coffee of course, was to review my server logs [1]. As of yet I’ve not got enough staff to have a minion to do this for me, but to be honest I’d miss the connection to the real world of computing if I did [2]. I run a Linux server in a datacentre in Birmingham as my company’s main web-server and my high bandwidth, static IP’d pen-test machine. For the last few months I’ve been meaning to do something about the 404 errors (http://en.wikipedia.org/wiki/HTTP_404) that are being reported by Apache – some are my fault for taking pages away that people clearly still cross reference – the others though are clearly the work of automated web vulnerability scanning tools.

Vulnerability scanners (http://en.wikipedia.org/wiki/Vulnerability_scanner) are the bottom end of the pen-test toolkit – they are to penetration testing what the Windows “find” command is to digital forensics; e.g. superficial and basic. There are various types – but of interest today are those that operate on the application layer over HTTP (http://en.wikipedia.org/wiki/ISO_model#Layer_7:_Application_Layer). In the open source market both Nikto (http://www.cirt.net/nikto2) and Nessus (http://www.tenable.com/products/nessus) [ Nessus isn’t open source per se, but is free for home use … ] are examples of products that perform tests against webservers for potentially insecure CGIs and files – the trouble with this is that in order to determine if an insecure CGI script or file is present, the scanner asks Apache for it, and receives a 404 if it isn’t there, each 404 is written to the log, and when Nikto, for example, tests for over 6400 possible vulnerabilities you can imagine what the logs look like ! Sadly, tools like these, as they are available to everyone, are not only used by the kind of people that get written authorisation before testing your web server …

Apache, however, is a good thing – it allows you to reconfigure your 404 error messages in a number of ways. Most simply it allows for you to return a configured 404 page – one that matches the look and feel of your website, and perhaps allows you to indulge your love of haiku (http://www.salon.com/21st/chal/1998/02/10chal2.html). This however is for the weak and lazy – you can also pass it to a script, one which can perhaps guess what your user meant, or at least one that redirects them to where you want them to be and, perhaps, perform some other manipulations along the way …

Over hundreds and hundreds of years, at La Brea in Los Angeles, tar has seeped up from the earth creating huge tar pits (http://en.wikipedia.org/wiki/La_Brea_Tar_Pits). These tar pits were often covered in water ( water and tar not being the natural combination to mix together ) – which tempted animals to come and drink – once they set foot into the tar, a slow, sticky and ultimately preservative end was inevitable. The idea of trapping ( and preserving – but I think that’s illegal ) script kiddies appeals to me, and it seems also to others. LaBrea (http://labrea.sourceforge.net/labrea-info.html) is a “tarpit” or “sticky honeypot” program that takes over unused IP addresses on a network and creates “virtual machines” [3]. It then allows vulnerability scanners and port scanners to connect to these “virtual machines”, but by slowing the response times gradually grinds them to a halt waiting for a response – effectively trapping them in the tarpit. LaBrea is a great tool, however it has some significant restrictions on how you run it – you need a reasonable range of IP addresses for it to be effective, and, in this modern day and age not many of us can claim that ! (Roll on IPv6 !) And it’s no good for a single server being scanned for Web vulnerabilities. So what we need to do is create the equivalent for web servers …

First off, we need to configure our Apache installation to redirect all unknown requests to our script, in the httpd.conf:

ErrorDocument 404 /pitchlake.pl

This, admittedly rather self-evidently, sets the 404 error page to our script pitchlake.pl (being a Brit, I’m obliged to work with commonwealth Tar Pits – http://en.wikipedia.org/wiki/Pitch_Lake ). The script needs to sit in the document root of your webserver (in my case /var/www/html). Also make sure that your Apache is happy to process .pl files as CGI, rather than just printing the contents.

AddHandler cgi-script .pl

(Check that ExecCGI is enabled too)

At this point in time, any page that creates a 404 will redirect to the script. Now we need a script which does something pointful … We don’t really want to penalise the user who gets it wrong by accident by tarring them up waiting for a response, so, like a password or login protection, we’re going to increment the timeout by a power of 2 each time a wrong request comes in – so the first wrong request won’t have any increased time, the second will have a 1 second delay built in – the second a 2 second delay, the third a 4 second delay, the fourth an 8 second delay – you get the picture … ( It’s not actually that large, it starts at .1 of a second, then .2, .4, .8, 1.6 etc. so for a real person making an honest mistake – there’s a bit of flexibility) Also, anything that is older than two hours gets cleared from the database to stop it from clogging up over time. I can see that there are areas that this could be improved in – pre-emptive increases for people scanning for known URLs for example, and also there should be some tools to extract some relevant data – keep an eye on the web page if you are interested – I may get around to doing some of them !

In the meantime – Version 0.3.3 of PitchLake is available here – http://www.thinking-security.co.uk/pitchlake.html – along with some further information on the database. And you can test it by going to pretty much anything at http://www.thinking-security.co.uk that doesn’t exist ( try bob.html for example ).

Click here to discuss this article.


[1] Nobody reads all of their server logs if they have any sense – you need to apply some tools to filter the mundane and ordinary – I use “logwatch”on my Linux servers to extract the pertinent.

[2] Cue flashback to my original career as a SysAdmin with hundreds of UNIX servers as my responsibility – occasionally I long for the “good old days”. Usually when I’m asked about PCI/DSS compliance …

[3] But not “Virtual Machines” in the sense of VMWare, more in the sense of the Turing Test – they answer questions like a computer, but there’s no real processing going on behind them … These operate more at the Transport Layer (http://en.wikipedia.org/wiki/ISO_model#Layer_4:_Transport_Layer)

Read Simon’s previous columns

Simon Biles is one of the founders of Thinking Security Ltd., an Information Security and Risk Management consultancy firm based near Oxford in the UK. He has worked on security projects for commercial, charity and government organizations for over 10 years. Simon is studying Forensic Computing at Cranfield University, although very slowly because of work commitments! He posts on the forum as Azrael and you can read an interview with him here.