Steve Jackson: Hello, everyone. I hope you’re all well. Welcome to this introduction to Binalyze and a presentation on delivering cyber resilience with enterprise forensics.
So before we begin, and while we’re waiting for the last few people to join the presentation, just a few housekeeping points. There is a panel on the right-hand side for you to submit questions and comments. We will answer all the questions at the end of the webinar, but I’m sure they’ll pop into your head as we go through the demonstration. So please write them down there and we’ll deal with them at the end. We also have a Discord server for more technical discussion and technical support. There is an invite to that server in the chat. So please use that link and we’d love to see you over on Discord.
And for existing users of Binalyze products, just a reminder that technical support is always available at binalize.com/support, or by email at support@binalyze.com.
So for many of you, this will be your first interaction with Binalyze. So just a very quick introduction to the company itself. We were founded in 2018 and the company is based in Estonia. It’s founded by and run by Emre Tınaztepe, who is joining me on the call today is a 15 year cyber veteran and former commando.
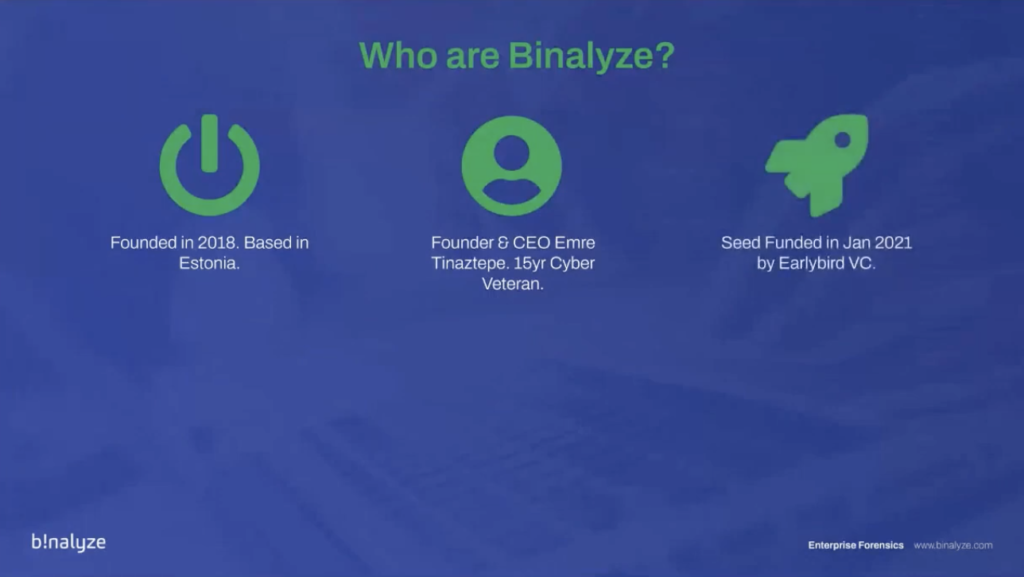
We were fortunate enough to be seed funded in January of this year by Earlybird VC, which is one of the largest tech VCs in Europe. They also have three unicorns under their belt already. We’re hoping to be the fourth. We’re also fortunate to have a highly experienced advisory board, which includes veterans of law enforcement, including the NYPD cybercrime head — former head — in New York, and corporate CISOs from the likes of Microsoft and Standard Charter.
The secret sauce of Binalyze is 80% of the team have worked together for more than 10 years. This is our second startup together. As a result, we’re highly aligned and we iterate at pace. So if you are familiar with us, you’ll know that the product updates come thick and fast, new features, and the full roadmap. And we were fortunate enough in the previous startup to work with Comcast and 10 million customers in the US. And the reason why I’ve included that is because it’s really driven the philosophy that we have at Binalyze towards product development, which is to make it lightning fast and easy to use. And hopefully you’ll see that in a few moments when we begin the demonstration.
So I’m sure many of you have spotted the trend recently towards building cyber resilient strategies as part of the overall security posture. Binalyze is the platform to deliver on that strategy. We’ve been doing that for the last three years. This short video from Harvard medical school was something of a Eureka moment three years ago. And it does a really effective job of explaining Binalyze’s product market fit. The video also has two million views, and I think Emre is responsible for most of them!
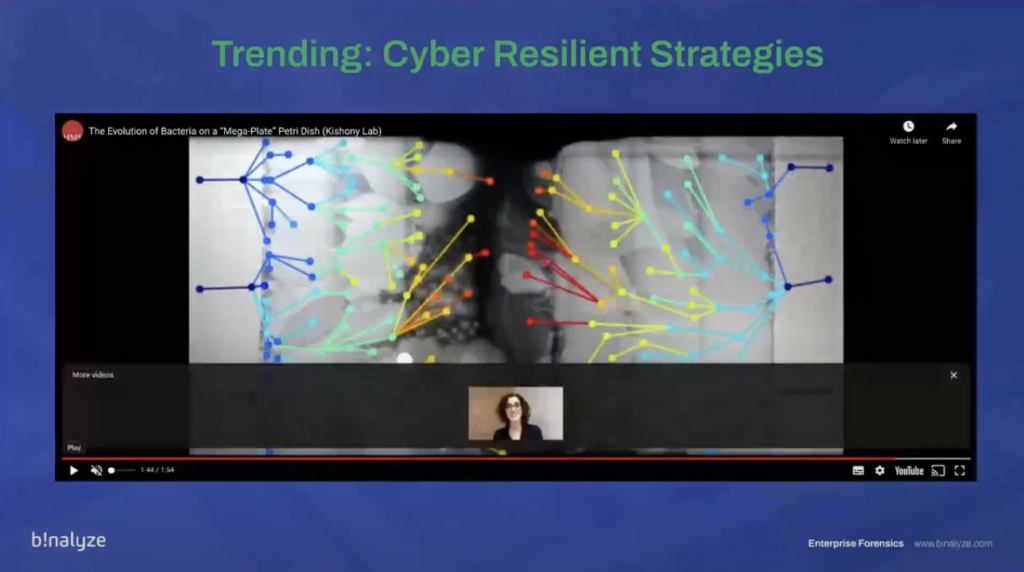
I’ll just speed it up so we can get there pretty quickly. So what we have here is… or what Harvard medical school have here, is a Petri dish with nine barriers of varying antibiotic strength. So zero on the outside, increasing to a thousand in the middle. And when they placed the bacteria in the zero strength area, predictably, it fills, but it can’t get into the 1 strip, until it does. Some of the bacteria adjusts and evolves and starts to spread again. And the same thing happens at each barrier until bacteria is able to grow in the thousands of strength antibacteria. This is a great metaphor for what the cyber industry has been doing for the last decades, focusing on increasing the number and strength of protective barriers. Despite that, breaches are continuing to happen and increasing in frequency. And so this is the drive towards cyber resilient strategies.
What you see here on the screen at the moment is what Binalyze does. We quickly show the picture of the cyber crime scene, and you can understand what, when and how the breach occurred to limit the exposure time and the risk.
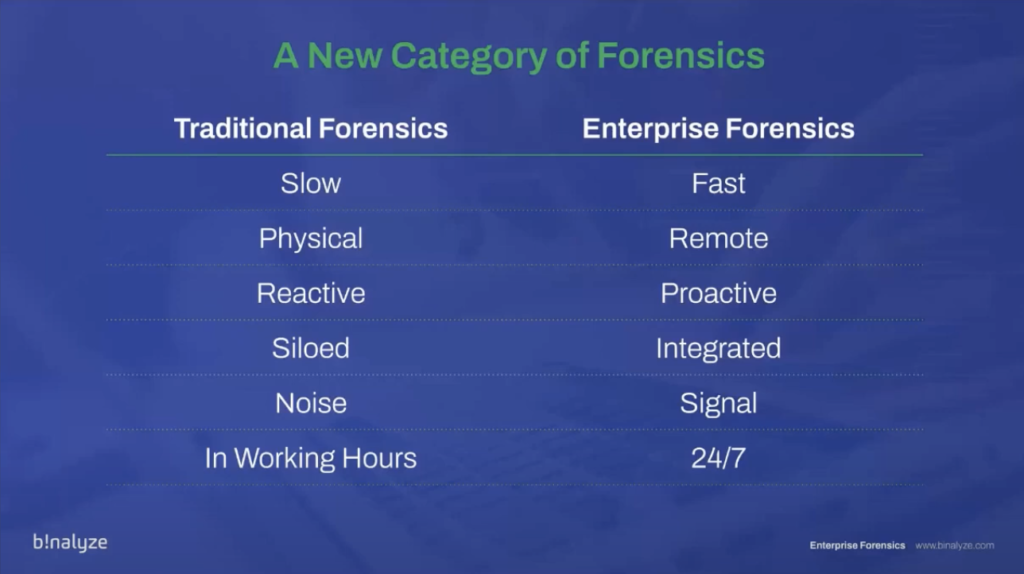
So what’s the tactical solution for delivering a cyber resilience strategy? Well, we believe it’s enterprise forensics. But digital forensics has been around for a long time. So why, what’s the difference between traditional forensics and enterprise forensics? And why do we believe this is a new category of digital forensics?
Well, where it was previously slow, taking many hours, sometimes days, to take a disk image, we’re trying to make it fast. And we’ll show you that in the demonstration shortly. What was previously physical — needed to be at the scene — is becoming remote. What was reactive is becoming proactive. Siloed data that was stuck with individual analysts is becoming integrated with other business systems and shareable within teams. Taking terabytes of data is a noise based methodology. Whereas we prefer to focus on the signal, the relevant information. And of course, traditional forensics is available during working hours; enterprise forensics is 24/7.
So if you’re familiar with Binalyze, you may well know the product IREC. This was our first product, which we developed three years ago. IREC has now matured and evolved into the engine of all of our products.
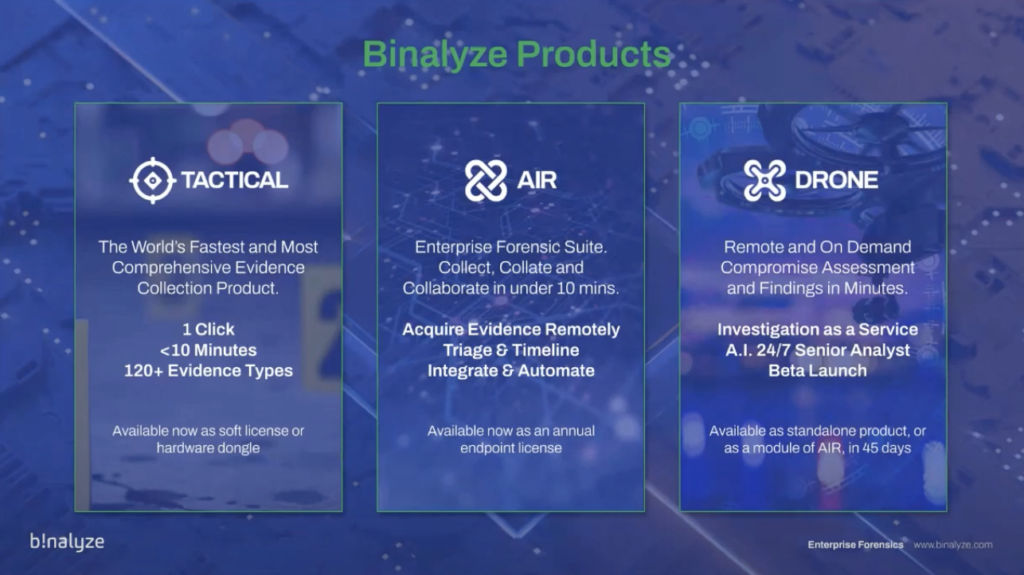
So the current product matrix is TACTICAL, which is our evidence collector. So with one click, in less than 10 minutes, we’re collecting 120 different evidence types. And that product’s available now as a soft license or as a hardware dongle.
AIR is our enterprise forensic suite. So this is our flagship product where you can collect, collate and collaborate in under 10 minutes. And we’re going to demonstrate this for you today: acquiring evidence remotely, triaging and timelining, integrating and automating. And this is available now as well as an annual endpoint license.
And launching today is DRONE: our remote and on demand assessment product. We’re calling it Investigation as a Service and consider it like an AI senior analyst that’s available 24/7 and can be triggered when the breach occurs. And we’re going into beta launch of this product tomorrow, actually. But it will, within 40 to 45 days, be available as a standalone product and also as a module of AIR.
So with that quick introduction, let’s begin the demonstration, and we’re going to show you four principal things today. The first is remote collection of 120+ evidence types in under 10 minutes; remotely performing triaged at scale and generating collaborative timelines; triggering tasks by our integrations with other systems such as SIEM; and automatically analyzing evidence for fast compromise assessment. And with that, I’m going to hand you over to Emre who will take you through the demonstration.
Emre Tınaztepe: Thanks a lot, Steve. Hello everyone. Thank you for joining us today. Can you see my screen?
Steve: Yep.
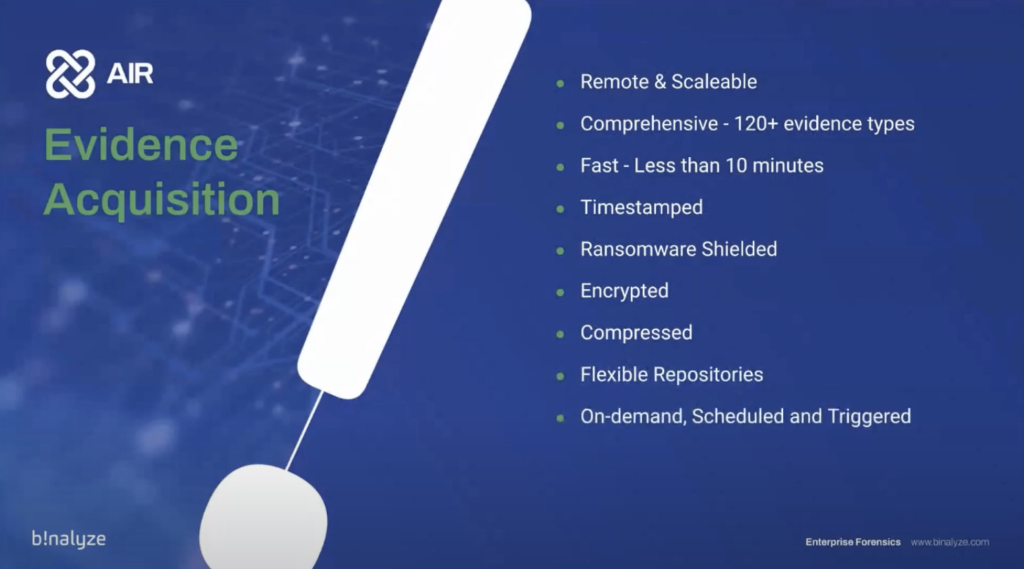
Emre: All right. Let’s start. Today we’ll be demonstrating Binalyze DRONE, which is the fastest way of making a compromise assessment. But since AIR is the best way of launching DRONE, we’ll first go over the features of AIR. And the first feature we’ll be covering today is the evidence acquisition. That’s actually why AIR was developed in the first place.
So using AIR, you can remotely collect evidence from a number of endpoints, and the list is comprehensive. You can collect over 120 different evidence types. And it’s really fast. You can collect the evidence in just 10 minutes. All the evidence is timestamped. So that way you have a proof that that specific evidence existed at that specific time.
Another unique feature of AIR is ransomware shielded, because you know, when you have a machine that is infected by ransomware, ransomware does not discriminate whether it’s an evidence or a document file. So whatever is collected, whatever the machine has access to, is immediately encrypted thanks to this feature of Binalyze AIR and IREC, all the collective evidence is shielded against any modification by ransomware.
And by default, we provide evidence compression. So all the evidence you collect will be compressed, and you can optionally enable encryption as well, and all the evidence will be encrypted by IES.
In terms of where to save the evidence, we have a number of options. Starting from the early days, we have local repositories, so you can save the evidence onto the target machine, or you can save it into an SMB drive, network share, basically, that is protected by username and password. And in the recent versions, we have support for SFTP. And in the upcoming version that we’ll release this month, you will also have, cloud evidence repositories, such as Amazon S3 buckets or Azure block storage.
We can perform this acquisition on demand. So whenever you need to collect something from an endpoint or a group of endpoints, you can start an acquisition, or you can also schedule acquisitions on a weekly, daily or monthly basis. So that way, especially for critical assets, you’ll be able to collect evidence regardless of whether you have an alert from the endpoint or not. So you’ll continuously have all the relevant evidence collected.
And another great thing about AIR is you can integrate AIR with your [indecipherable] or any network source, basically, and you can trigger the acquisitions based on the alerts these products generate.
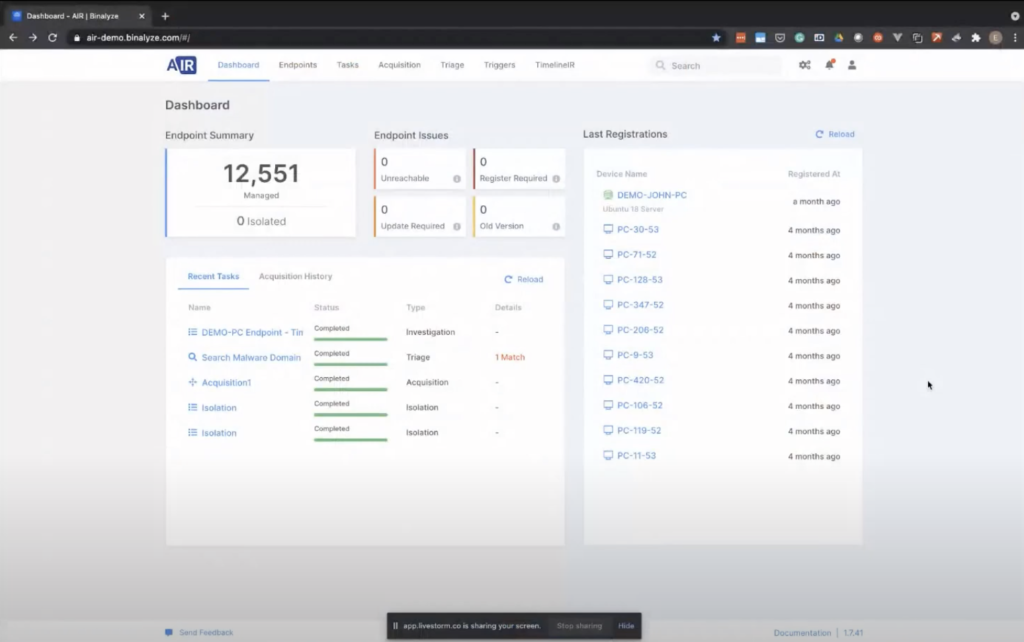
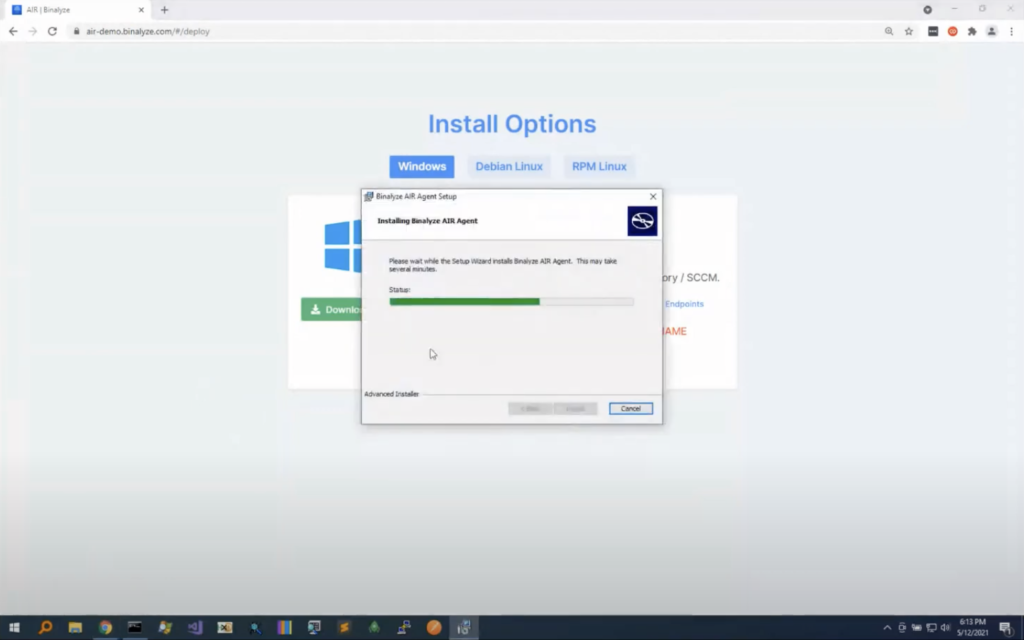
So let’s go to the AIR console and see how it works. I’ll first start with the deployments, because I really want you to see how easy it is to deploy an endpoint agent. When talking about endpoint agents, by the way, our endpoint agents are passive. And that’s the first thing you’ll notice when you install. I mean, the resource usage is just four megabytes on the endpoint. And the reason they’re called passive agents is they’re not doing any scanning on the endpoint unless you ask them to do so. It’s just like having someone always available 24/7 on the endpoint. And whenever you click the button, or whenever your SIEM generates an alert, you can ask them to immediately start taking actions.
I’m going to first deploy to a Windows device; you can also deploy to Linux devicess. So you can either download the executable by clicking the installer, clicking this button. It supports 32 bit and 64 bit. And we also have an easier way of deploying it. If you visit this URL from an endpoint that has access to the address, let’s visit it, and download it, as you see, it’s just the 10 megabytes executable and it’s zero configuration. So the only thing you need to do is just click and run, and in just 30 seconds, installation will complete.
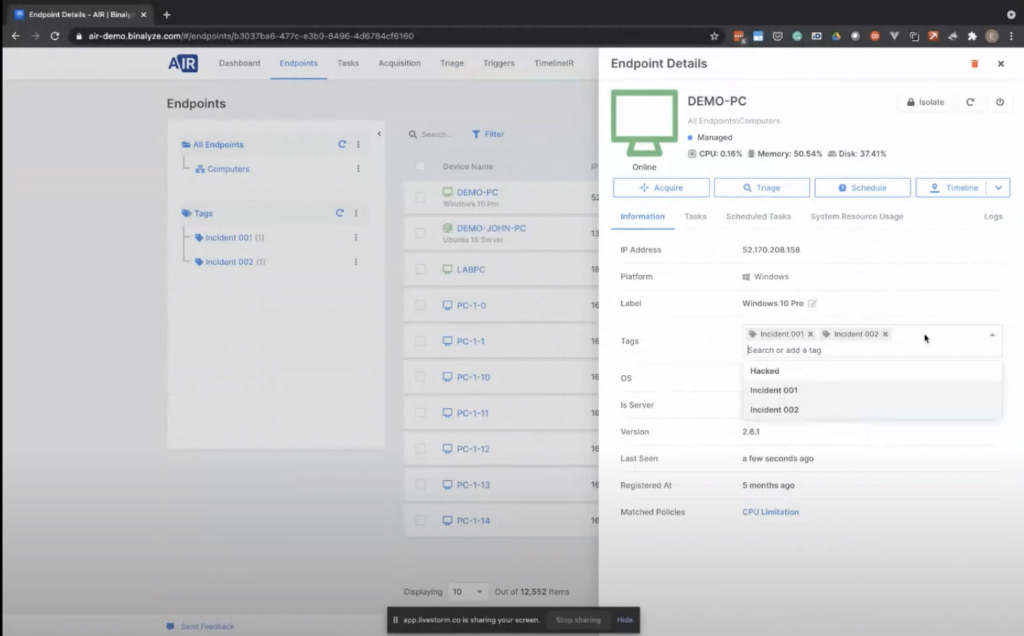
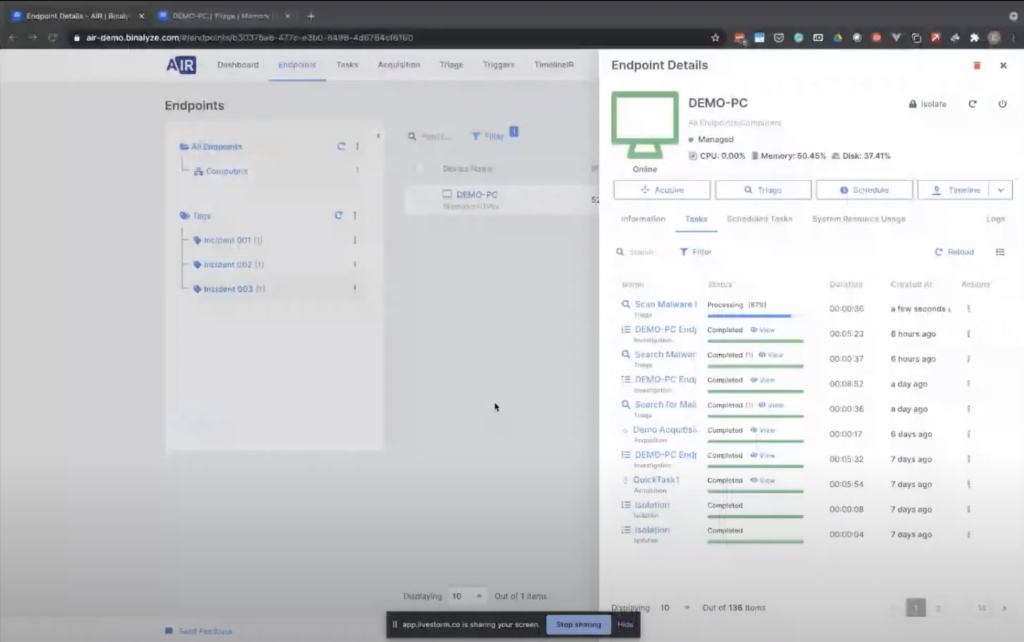
Now, going back to the endpoints page. Now we have our LABPC register. From now on, you can click on the endpoint and start taking actions. The first one will be acquisition. And you also have some other information here, such as information about the endpoint, like all the previous tasks. And if there are any scheduled tasks, we can also see them here. So clicking the information you can also attach tags to the endpoints.
Let’s first start with the acquisition. Clicking Acquire, the only thing you need to decide is, what do you want to collect from the endpoint? We already provide some out-of-box acquisition profiles, such as full browsing history event, logs, memory, and REM… REM, and pagefile, basically, and a quick acquisition profile. For the demonstration purposes, we’ll go over this first one. So this is an acquisition profile we have created for one of our SIEM playbook actions. And what you need to do is giving it a name.
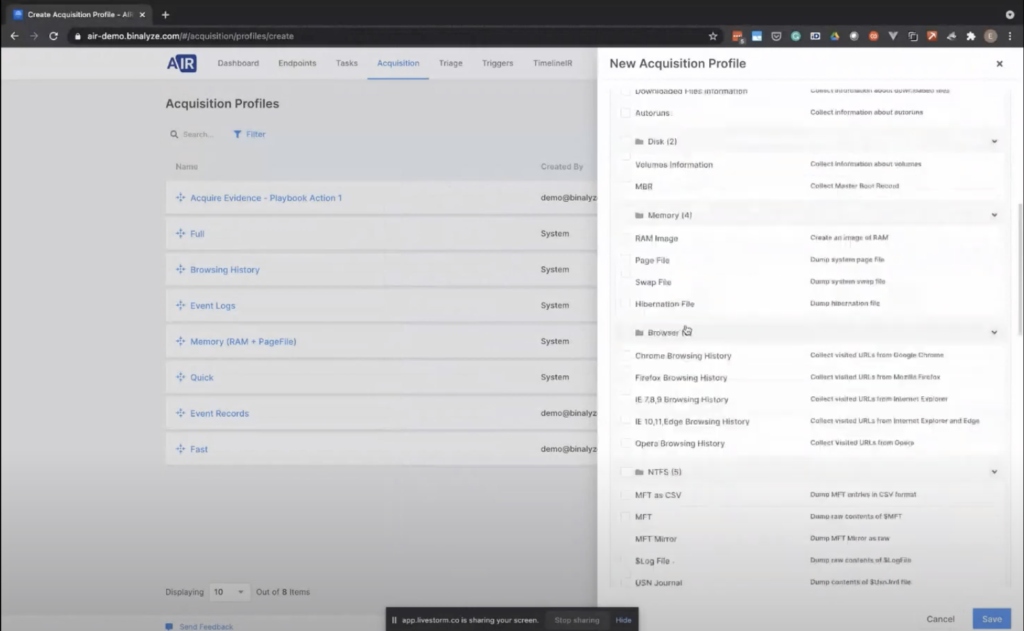
Let me show you the acquisition profile. So in case you need to create a new one, you can easily click this button. So that way we can see what we collect. We have three sections here, in this acquisition profile. So let’s give it a name.
In this first section, we have all the system related artifacts that can be found on any endpoint, starting from Windows XP. And this list is, like, we have in total 64 evidence types, and the list contains all the installed applications, downloaded files, disk-related evidence, like memory related evidence, all the major browser histories. We have NTFS, all the registry artifacts. Another important thing about the evidence collection is we collect both evidence, and we also parse the collected event. So no further processing required.
As an example, event logs are a good example of this. So you have an option to collect EVT and EVTX files, but selecting this option will also parse all the relevant information from those event logs and will provide them in the report.
So we have over 60 evidence types here, and you can also collect the application aspects. If the machine is running some server — as an example, IAS, or like [inaudible] — you can also collect the logs of these applications. And we have around 60 evidence types here.
And that’s not all; you can still customize the collection. So just by creating a new custom content profile here, adding a [indecipherable] pattern here as an example, if you’d like to collect all the PDF files, you can also attach this to this acquisition profile. So whenever one of your investigators use this acquisition profile, all the evidence you have selected will be collected.
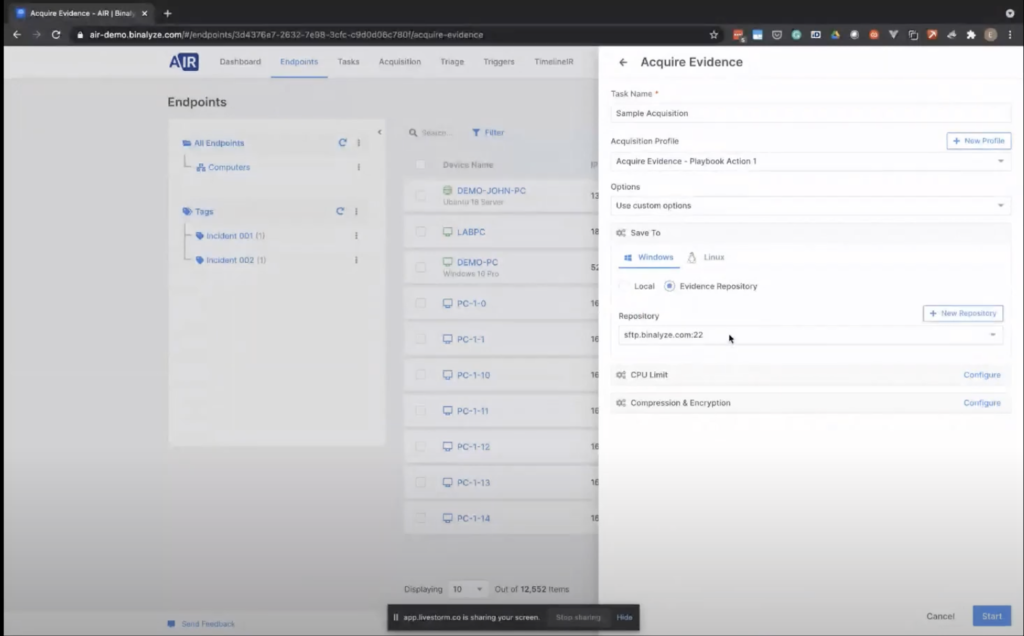
That’s the same for Linux. So let’s go back to or acquisition page. Let’s give it a name. And there are a number of options here. By default AIR has a default policy. Using the policies, you can configure some… like, the properties of an acquisition. In this case, it will be applied to default policy, but let me switch to the like use costumes option so we can see what type of options are able to be here.
So the first one is, you can choose the evidence repository: in this case, we will be collecting evidence into the local machine, but you can also choose a remote evidence repository: in this case, it will be an SFTP server. And as mentioned earlier, we’re also adding support for cloud evidence repositories in the upcoming version. You’ll also have an opportunity to save the evidence into the cloud directly.
And even though AIR is extremely lightweight, when you have like, especially in large enterprises, there may be some compliance requirements. So you can also limit the CPU usage in case it’s required by your enterprise.
And for a compression, it’s enabled by default, but you can also provide an encryption password, that way all the evidence will be encrypted with that password.
Let’s click start. An important fact about assigning tasks to the endpoint: task assignment is in real time. So all the endpoints are connected to the AIR console in real-time. So whenever you assign a task, the task is immediately sent to the endpoint. And as you see here, the endpoint, so it’s not a pulling mechanism, endpoints are already connected to the management console. This becomes especially important when you integrate AIR with your [indecipherable] products, because when these products create an alert, then you have a chance to immediately assign a task to the endpoint in a completely automated way. And that way, when you want to investigate the endpoint, even that alert was generated 3:00 AM in the morning, you still have all the acquisition report.
So as you see, it’s like… it will be finished in a minute. Let’s click on a previously acquired one. Once you have the acquisition, clicking that view button takes you to the case report.
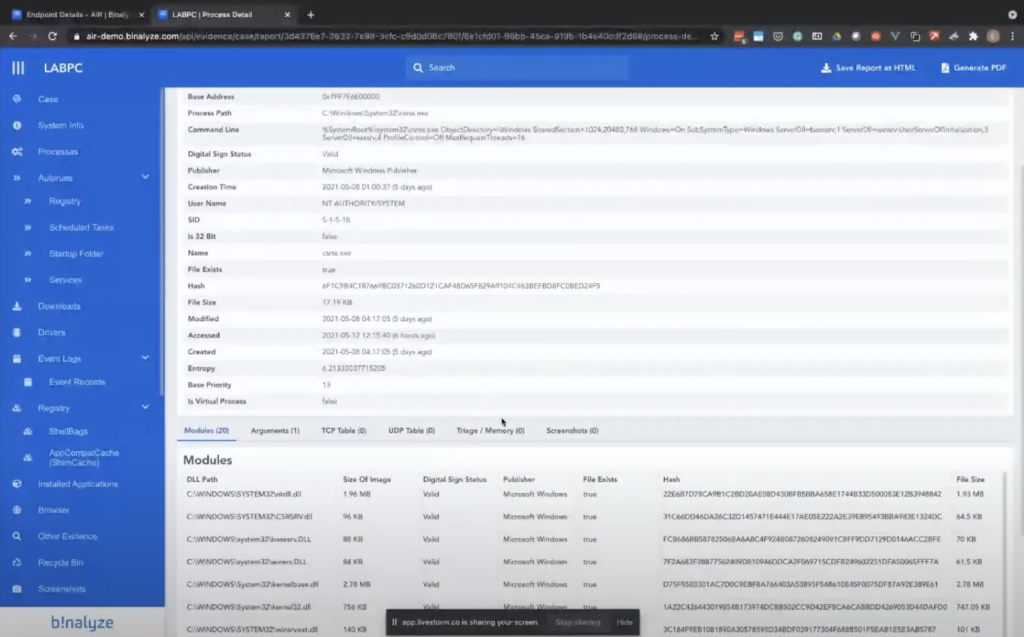
And this case report is a report that we have been working on for the last three and a half years. So it’s extremely well-organized and it contains almost everything you may require when it comes to investigating endpoints.
So it starts with the system information. We have all the processes here, and clicking on individual processes takes you to the details page. In this page, you can see all other information about the process, like the TCP connections UDP collections. And if there is a match, we’ll be talking about the triage in a second. You also see all the matching rules here, and we have auto runs, scheduled tasks, like startup folder services, all the downloaded files, where they were downloaded from, and we do our best to make it as easy as possible. When you have this report, like 99% of the time, you won’t be required to do any further parsing of the evidence. And there are some quick links here. So if the file is on [indecipherable], you can like one click, get the result from our portal. So basically, whatever we need is already included here.
And another good thing about this report is you can easily run some searches inside this report. And as you see, we have some matches in the listed sections, and clicking on them quickly highlights the matching ones. And this report is self-contained. So when you download it as an HTML file, you won’t be required to share anything else with the third party. So if you want to share this report with another colleague of yours, you can just download the HTML and share it, and they’ll see the exact same collection report you’ve seen. Or you can also generate a PDF out of it. And for PDF generation, we even support like individual columns selection.
So that’s the acquisition part. And the previous one is already completed. Let’s go back to our slides and talk about the second one.
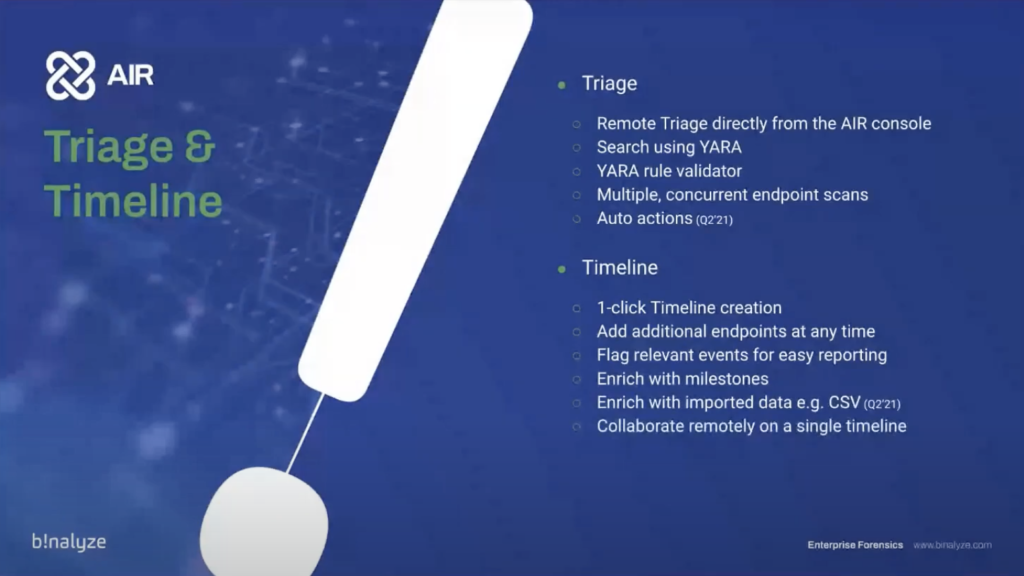
Using AIR, you can also run a triage on either a single endpoint or a number of endpoints. Using YARA rules, you can easily sweep all your environment, and you also have a YARA validator. So in that case it doesn’t let you do any mistakes, or before running the task on the endpoints, you also have an opportunity to validate through. You can do this on multiple end points.
And in the upcoming version, you’re also combining this feature with auto actions. So basically, auto the actions areL you’ll be able to provide some actions based on a playbook; that way, whenever you have a match in one of your endpoints, all the actions provided in that playbook will be automatically applied to that endpoint.
As an example, if you have a match in a web shell file, you’ll be able to automatically delete that file. Or if there’s a match in one of the processes, you’ll be able to dump the process and collect all the information about that process. You can pull from basically any action, including automatically isolating the endpoint.
And using the timeline AIR feature, you can create a timeline of an endpoint, or a number of endpoints, with just one click. And when you start with one endpoint, you can also enrich this timeline by adding multiple endpoints anytime. The good thing about timeline is it’s collaborative. So multiple investigators can work on the same timeline and you can enrich the timeline with milestones.
And in the upcoming version that we’ll release at the end of this month, we’re adding support for enriching the timeline with CSV files. So basically you’ll be able to import any CSV, as long as they have a timestamp column in them. So you’ll be able to use your firewall logs for some cloud storage logs. So any type of CSV that has a timestamp column will be usable in the timeline feature.
Let’s go back to console and start a timeline on one of our endpoints. So let’s first go with the triage. So for triage feature, we have a button here. When you click triage, you see all the previously created YARA rules. Let’s go back to triage page and create a new one, clicking this new rule, you’ll give it a name. ‘Malware domain search’, as an example.
You have three options here. You can either search the rule in both memory and file system, or you can individually scan memory and the file system. So clicking memory, we have some examples here, and we’ll be searching for a malware domain, and you can just basically replace it and see what are the processes that have this string in their memory.
Even though I’m not sure if it’s visible now, because there’s an overlay here, but we have a validate rule button here. But it doesn’t matter because when you save this rule, the rule is automatically validated and saved. So going back to the endpoints page, looking back again to the demo PC, and now we can start the action.
There’s another feature that really helps when it comes to running triage. If you want to limit the scope of a triage to let’s say 10 endpoints, what you can do is you can quickly add a tag to this endpoint, let’s say incident three, and then we have a new tag here. And when you click on that tag, you only see that endpoint. So you can add multiple endpoints into this tag and then perform all the actions we have covered by clicking this trade-off button here.
So let’s run a triage, select the rule. You can say multiple rules, by the way, and still just like in the acquisition case, you can configure the CPU usage if it’s required by your compliance. So let’s assign a task name.
And sending it, just like the case with all the other task assignments, it’s in real time. So all the endpoints are pushing this information, and they immediately start processing the task. And once it completes, as you see, a basic process scan takes around like half a minute. Clicking on this view will provide you with the same report that contains all the only the memory scan of that endpoint. So as you see, if you have a process that contains that string… and we’ll be adding support for the other actions and when it comes to timelines… let’s wait for this to complete.
So clicking this timeline, you can either create a new timeline, or you can add this endpoint into the existing timeline. Let’s create a new one now and give it a name. A random name. And then selecting multiple end points from here will immediately assign a timeline creation test to the end point and in just five minutes — and the secret here is we are collecting only the relevant information by seeing relevant… as an example, over 170 event log records were collected. All the timestamps of the processes. So whenever it has a timestamp that can prove useful in an incident response case or in an enterprise forensics investigation is immediately collected. And once the timeline creation finishes, you’ll be presented with a similar timeline — let’s open this one.
So as mentioned in the beginning, it’s collaborative. And you may notice that it’s unusual looking time here. The reason you see itL when you have a scheduled task on the endpoint that is not executed, by default, that’s what Windows shows. So in case of a timestamp attempt, you’re showing whatever is visible on the endpoint.
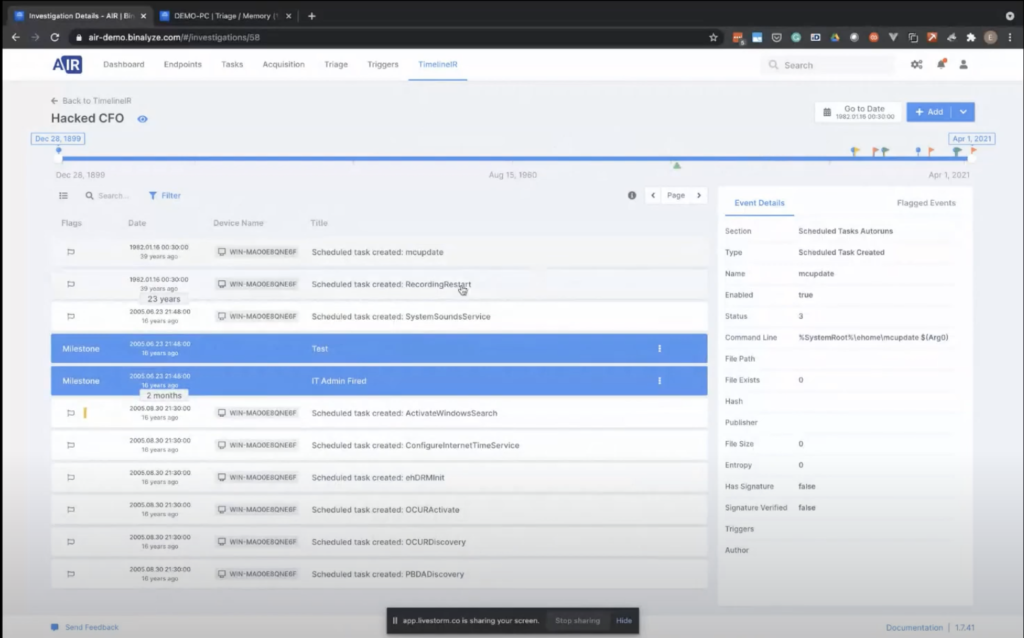
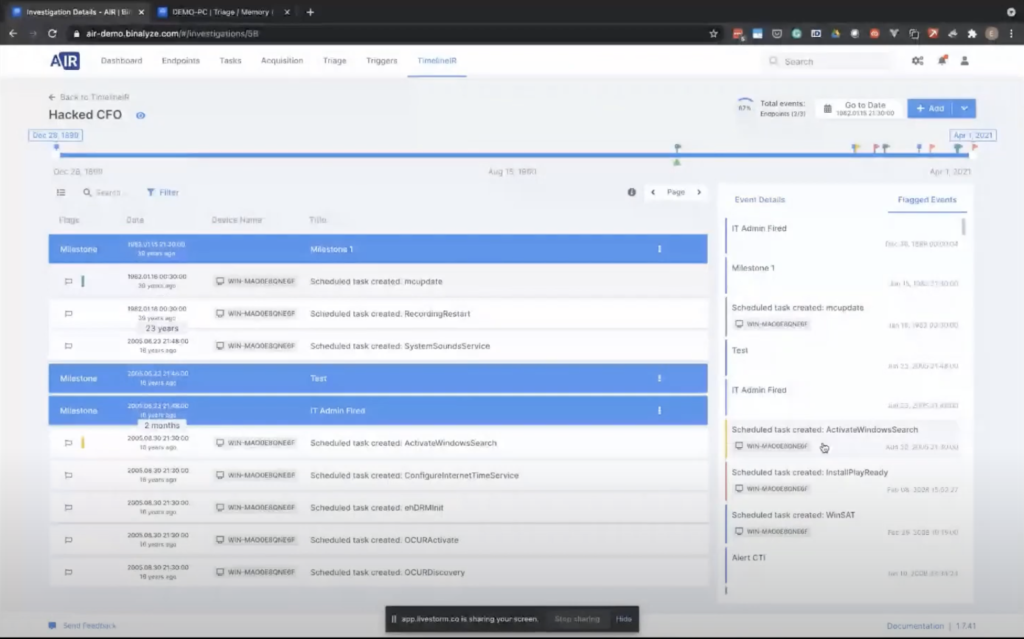
And by clicking on this timeline, you can easily time travel to that specific moment. And then you can also add some milestones here, or you can add flags. So I click by selecting one of these flags. You can quickly create a flag. And these flags are immediately visible to the other investigators. And even though we didn’t mention, AIR supports roles and privileges, so whoever has access to timelining features, they will be able to log into management console and join the investigation with the other investigators.
And if you want to add a new endpoint into this timeline for enriching it, you can quickly click this like end point button here, and you can select other end points. And once you select it, a task will immediately be assigned to the endpoint, and all the timestamped events collected will be merged into this timeline.
In the upcoming version, we are also adding support for CSV file. So basically you will be able to select the CSV file and then provide some mapping, because I mean, we designed it in a really generic way. So as long as you have a timestamp column, the only thing it will ask you is provide us with the timestamp, and maybe the format of the timestamp.
And here you can also add milestones. Milestones are basically like short notes for investigators to create some notes for themselves. So by basically adding a timestamp, a milestone here, let’s say Milestone 1, you’ll be able to enrich the case further. And when you click flagged events, all the milestones added will be visible here in a chronological order, so that way it becomes really easy when it comes to the reporting phase, which is also one of the most time consuming tasks of incident response and enterprise forensics.
And that’s the timeline. We already talked about some features of AIR. Let’s go back to the slides and talk about the integration and automation.
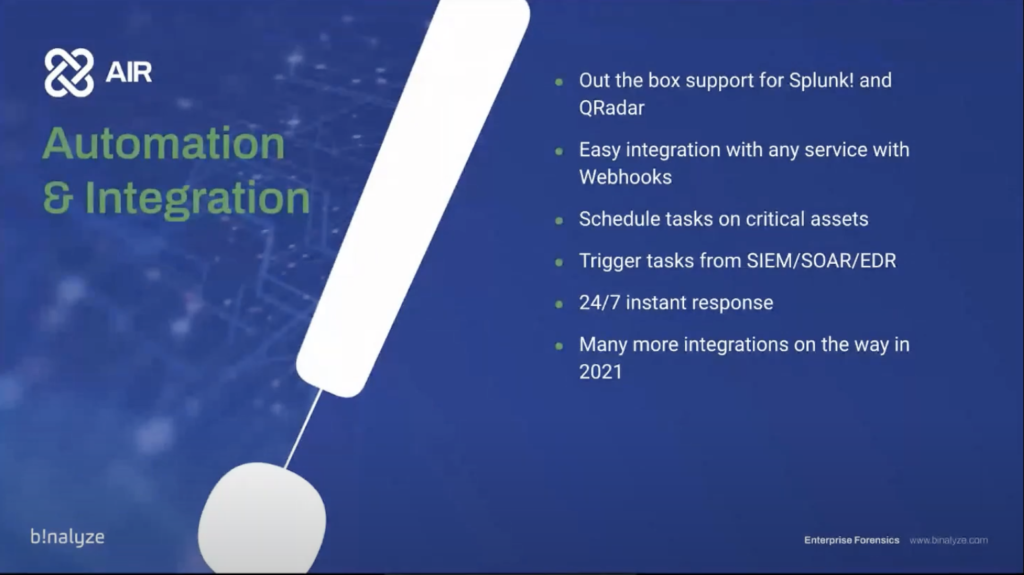
The great thing about AIR is, it supports out of the box major cm products. As an example, we have out of the box support for Splunk and QRadar, but that’s not the only CM product we support. It comes with a generic integration feature. So as long as the CM product [indecipherable], as long as they have a web hook support, you can in just five minutes, integrate AIR with any product on the market. This way you can automatically trigger tasks.
So whenever these products create an alert, our product will be immediately arriving to the crime scene, taking the highest resolution pictures of the crime scene, and then in the upcoming version, you’ll be able to also perform some actions based on the playbooks. So this makes it 24/7 incident response, and we have much more integrations on the way in the upcoming period.
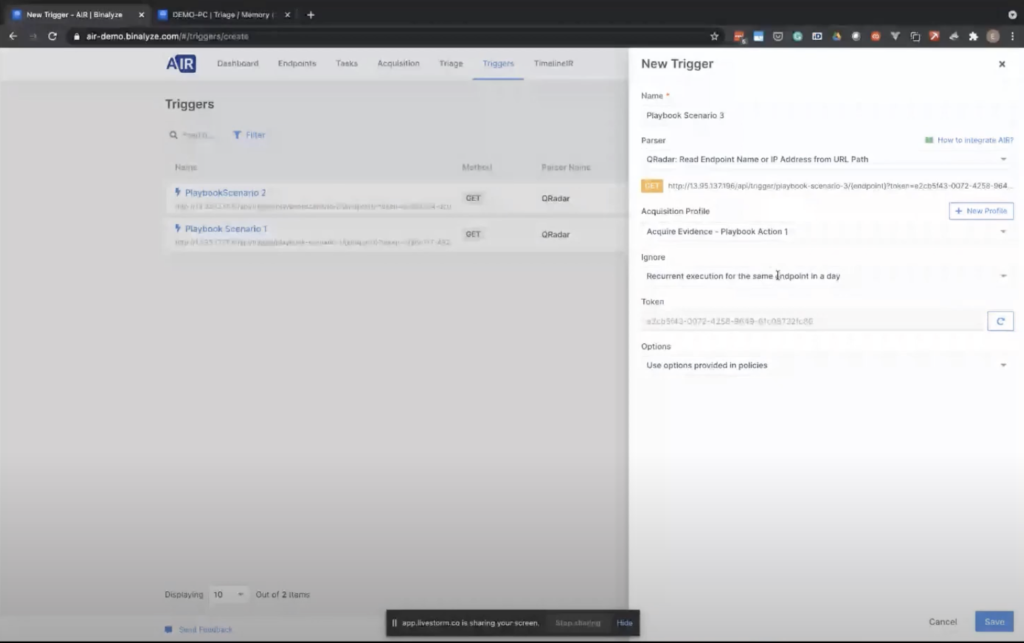
So let’s go back to AIR, and click to the triggers page, and create a new trigger. In this case, we will be naming it as Playbook Scenario 3.
One thing to note here is, you’re not interested into the nature of the alert, so you can integrate with any web hook source. And as an example, in QRadar, these are called offenses. So you write some rules. And whenever that rule is triggered by an endpoint an offense is created. But AIR is not interested in the nitty-gritty details of the offense. What you do here is, you just select the parser as QRadar. I can also say like the other [indecipherable] here, or you can select the generic URL read that point name parser. That way, as long as you provide the endpoint name from here, maybe using a script… let’s go back to the Qradar.
And whenever this trigger is called by the CM product, we select the acquisition profile here. And one of the drawbacks of SIEMS is, they can generate concurrent alerts for the same endpoint. By using the ignore feature, you can ask AIR to ignore multiple execution, like recurrent execution, for the same endpoint in two hours, four hours, or in a day.
When you save this, AIR provides you with a URL. Copying this URL and pasting it into your SIEM product is all you need to do. And by the way, all the tasks we have started are completing one by one. So all you need to do is like copying this URL and pasting it into the SIEM product. And then the integration will be completed.
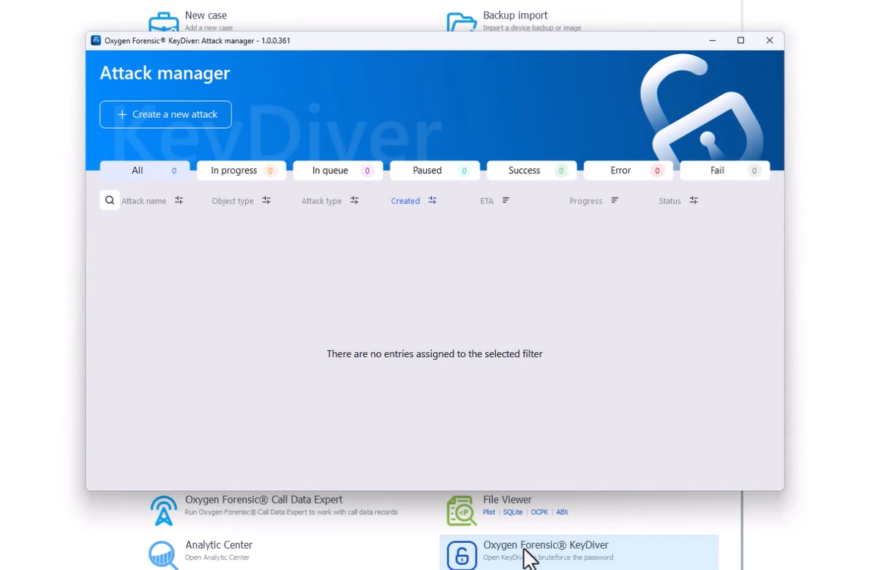
That’s all about AIR. The reason we have described AIR today is because we are super excited about our new products and AIR will be the best way of launching drones in a completely remote manner. So let’s start with the DRONE.
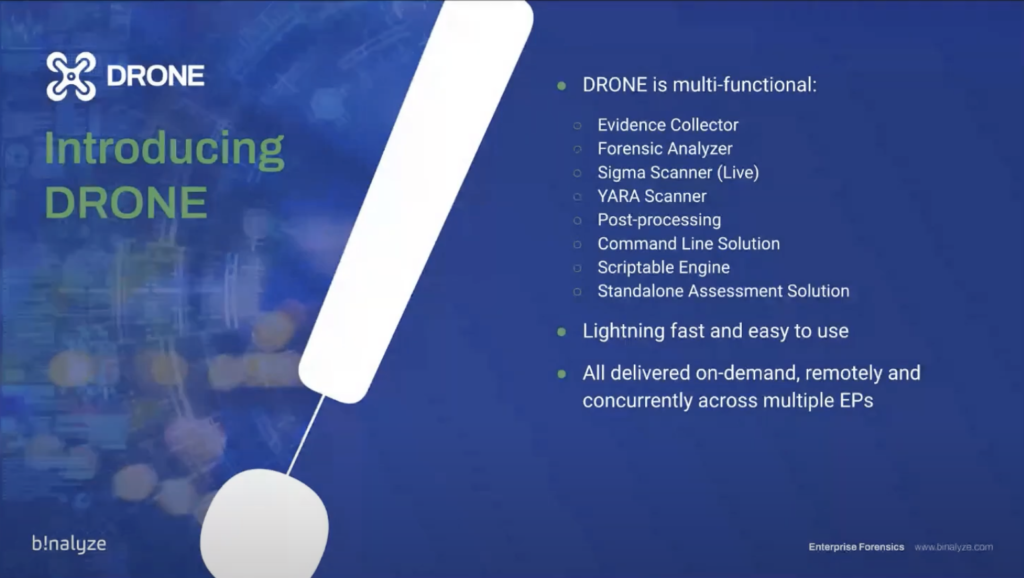
DRONE is actually a number of things. First, it’s an evidence collector. So you can collect over 120 different evidence types. It comes embedded with our IREC engine. It’s also a forensic analyzer. So you can ask it to analyze an already collected evidence.
Another cool feature about AIR is, it comes with an embedded signal scanner. So all the publicly available signals — and there’s a huge effort going on in Github — you can scan a live machine using the signal scanner. It also comes embedded with an ER scanner. You can run it on a live endpoint, or you can use it as a post processing engine. It also supports command line execution — today we’ll be covering them. And it also contains a scriptable engine, which will be open to public soon. So you’ll be able to add some scripts.
And overall, it’s a standalone assessment solution. It’s extremely fast and it’s really easy to use, as we will be demonstrating in a moment. And it’s all delivered on demand. You can also remotely deploy it across a number of endpoints.
Let’s talk more about deployment. As is the case with all our products, AIR is a zero conflict deployment product, and it’s a standalone executable. So you’re not required to install anything on the endpoint. It doesn’t have any dependencies, so it’s a self-contained file. You can deploy directly from AIR console as a manual task, or you can also schedule a DRONE deployment for your critical assets. So that way you can automatically deploy drones whenever you have an alert from your SIEM products. You can also deploy it using SCCM thanks to the zero config deployment. And you can also manually execute on the endpoint; that’s what we will do in a moment.
And you can also drag and drop existing evidence into the executable, therefore immediately scanning and analyzing the provided evidence. It also comes with a beautifully designed Tower UI. It’s like a control tower. And the great thing about Tower is, it streams the evidence right into your desktop or a website. Basically what DRONE does is, it turns an endpoint into an investigation session that can be connected by multiple investigators. And thanks to the upcoming feature, interact shell, so this version that we will demonstrate soon is streaming the findings into your browser. But in the upcoming version, you’ll also be able to interact with the endpoint by providing some across platform shell functions that are specifically designed for enterprise forensics and incident response. So we call it, like, it’s like a VR for investigators.
Let’s talk about the analysis targets. You can ask it to scan live end points, or you can run it on a group of endpoints. You can provide a case directory, which is acquired by Binalyze AIR or IREC, and in the upcoming version, we will also add support for EVTX files. And you can also ask drone to analyze any CSV or JSON file.
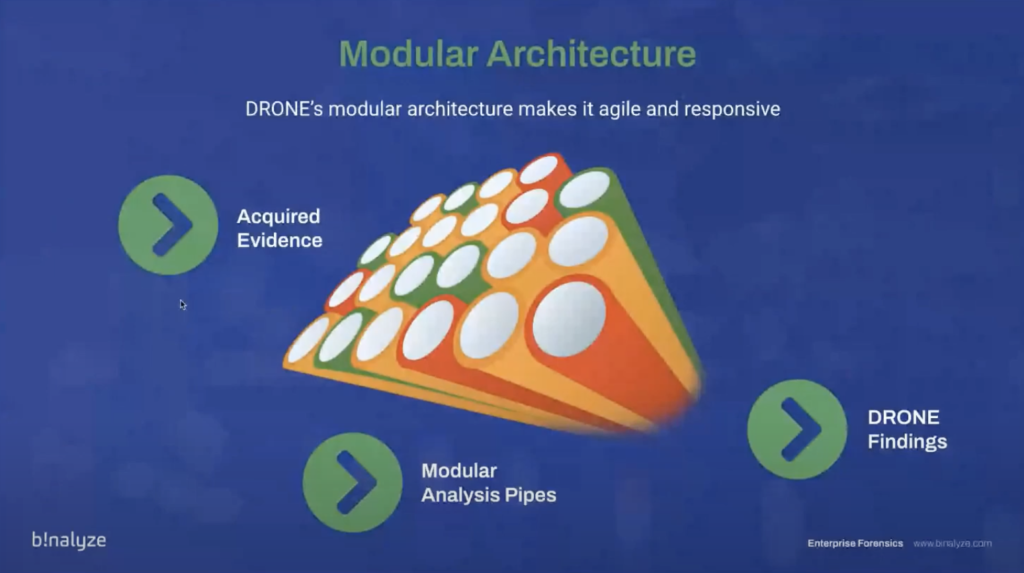
Before we talk about findings, let’s talk about some numbers. And when it comes to malware — this information is based on the latest AB test statistics. So as of the latest statistics, we have like every month, we have a billion malware in the wild, and that’s why AIR is designed not to detect malware. It’s actually a modular architecture. So it’s composed of modular analysis pipelines. This way it can acquire evidence, or you can provide an already existing evidence to that.
Once the evidence is provided to DRONE, it first passes a generic pipeline. And once the generic pipeline processing is completed, depending on the evidence type, it’s passed to an individual pipeline that is designed for that specific evidence. And at the end of this process… it may sound a bit long, but it just finishes in just, like, three to five minutes. And once the analysis completes you’ll be provided with findings.
The reason we call them findings is because DRONE works with two labels, let’s say. So, every finding may either have a verdict or a score. In the verdict section, finding may be dangerous, or if you’re searching for some keywords or some other rule, they’ll be highlighted as matched, or they can be suspicious, even though it may not be a detection. Even the rare items are also highlighted by DRONE.
As an example, if the machine has a network share attached to it, like mapped to it, this is not a detection itself, but it still provides useful for investigating an endpoint. So these types of evidence are marked relevant. And on the right side, it also scores the evidence. Because when the evidence passes from those individual analysis pipelines, each step in that pipeline may either increase the score of the evidence or decrease the score of the evidence. And at the end of the pipeline, you’ll have either high, low, or medium evidence.
Let’s first start with the first use case, and then we’ll be talking about the other use cases. So today we’ll first make a rapid compromise assessment on a live end points. And this use case, we’ll first collect evidence from the end point. And then we’ll be providing some keywords for DRONE to search on all the evidence areas.
One thing to note about this rapid keyword search is even though there are a number of solutions on the market that can search for evidence like [indecipherable] or YARA, the great thing about keyword searching in AIR, you’re not required to know any information about the type of the evidence. So the only thing you’ll need to do is, you’ll just provide some keyword, and that keyword will be searched in all the properties of every single evidence. At the end of the acquisition and analysis, you’ll be provided with an enriched acquisition report with all the label findings.
So let’s go back to our Windows machine. So DRONE is a standalone executable, as you see here, running it will start in console mode now, and then it will automatically start [indecipherable]. And by default, it starts in autopilot mode. This way you’re not required to do anything, but in this use case, we’ll be asking some searches. So let’s disable MFT analyzer, which may take an additional like three or four minutes.
So let’s provide some keywords here. Let’s provide some phishing.com. So this can be a URL, this can be a file name. Let’s say we just received a report from our cyber threat intelligence provider stating that one of our documents, let’s say leaked document, is being sold on dark web. So we can provide this. You can provide process name, or you can provide an IP address. And all that information will be searched in all the areas it listed below.
Starting the mission, AIR will immediately start an acquisition job, and there are a number of things happening in parallel now. So as you see on the left side, it’s collecting evidence and while collecting evidence, you still see some findings here. And the reason for that is we have a number of device scanners here. As an example, we have a generic webshell scanner, and we have an events of interest scanner. This is basically sweeping all the relevant event logs and highlighting the information you should be looking at when you need to.
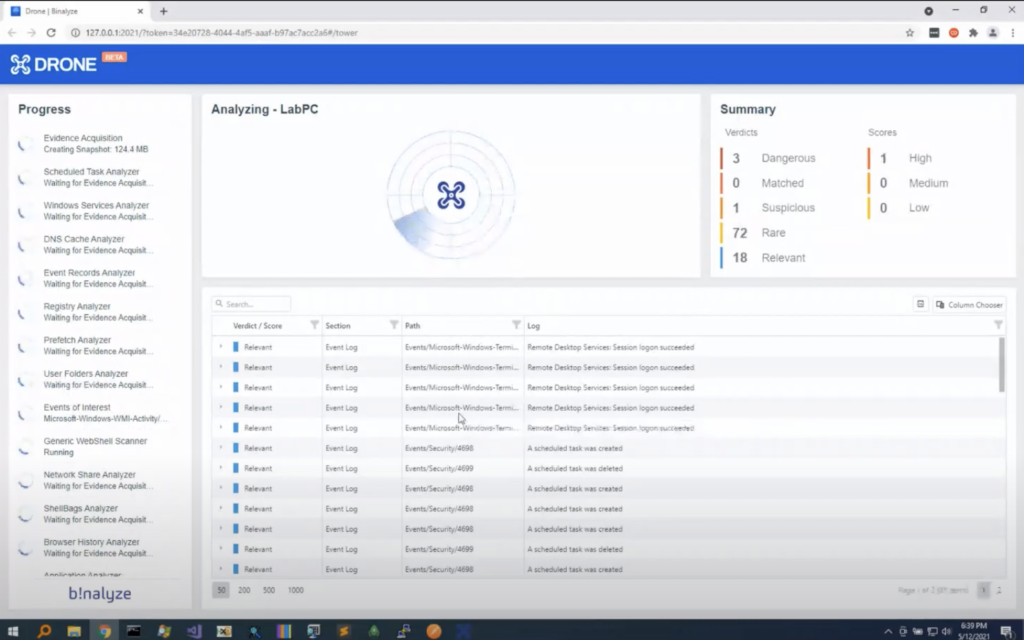
And once the investigation completes, we will have a full report. So while it runs, let’s go back to our slides and talk about the other use cases. We already have some like dangerous or suspicious ones, but we will get back to that in a second.
The second use case, as we have already seen in the report, AIR, you can use AIR for quickly running an application analysis on the endpoint. It will show you, it will highlight, all the recently isntalled applications. And again, and just like, like as a case for all the other sections in the evidence, you can search all these filled applications by keywords and by default it will automatically highlights all the suspicious and relevant ones.
As an example, it will highlight all the hacker tools. If there are any type forensic utilities that left traces on the endpoint, they will be also immediately highlighted, even though these are not detections or findings. I mean, we still highlight some important applications that may provide access to other systems in your environment. As an example, if the machine is running some enterprise management solution that may be used for [indecipherable], these are also highlighted. And we also show you the encryption tools and some cryptocurrency related evidence.
The third use case highlights all the events of interest, and this is made possible by the public Sigma rules. So it scans your scans, all events, of course, using public view signals and quickly highlights all the information in those event books. And as a side note, all the keywords you provide is run on the full event log details. So I mean, basically whatever you provide as a keyword will be searched on the event log as a full-text search.
And it also comes with a new feature that will be announced soon. We’ll be automatically pushing similar updates from drone.binalyze.com. So this way you won’t be required to pull up the, like, get an update for Sigma rules because they will delivered to your environment immediately.
As the fourth use case, DRONE scans for web shells by scanning web shells. It’s not only scanning your system with YARA rules. It can scan your system with YARA rules, but it also finds the outlay of resources by saying outlier. If there’s a web resource that was created in an unusual timeframe compared to the other ones, they will be highlighted as well. And it will also highlight high entropy files in the web server directories. So that way you can be notified about important or relevant or rare items.
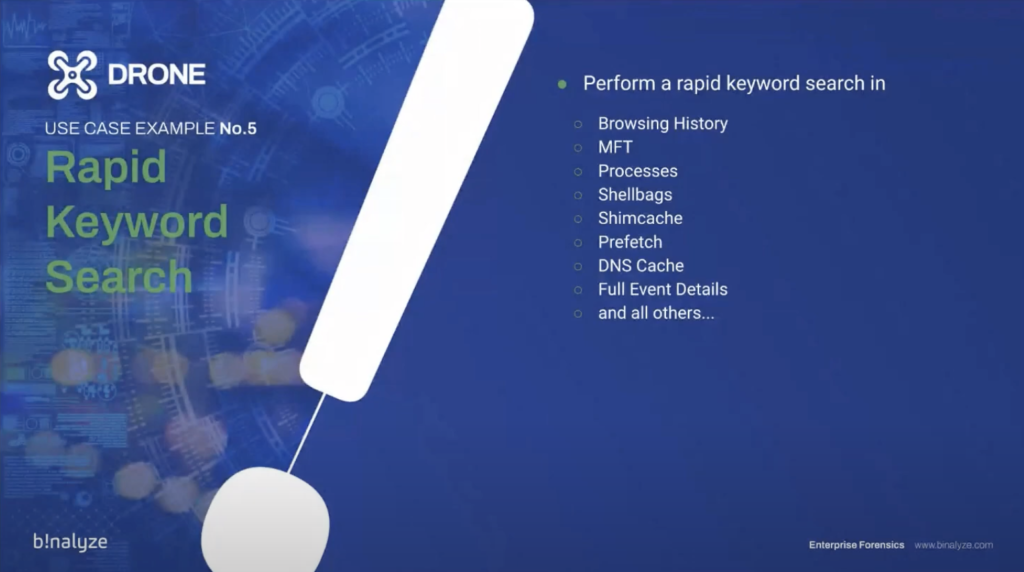
And as the last one, running a keyword search on the end points will provide you with the capability of running, searching all the browsing history, even if it’s deleted, which would be the case in some like incident response investigations, you still have a lot of other evidence that may contain the evidence. That’s what we’ll see in a moment.
So we can run a search on a master file table. All the processes, shellbags, as mentioned previously, you can run it on full event details, and all the other evidence.
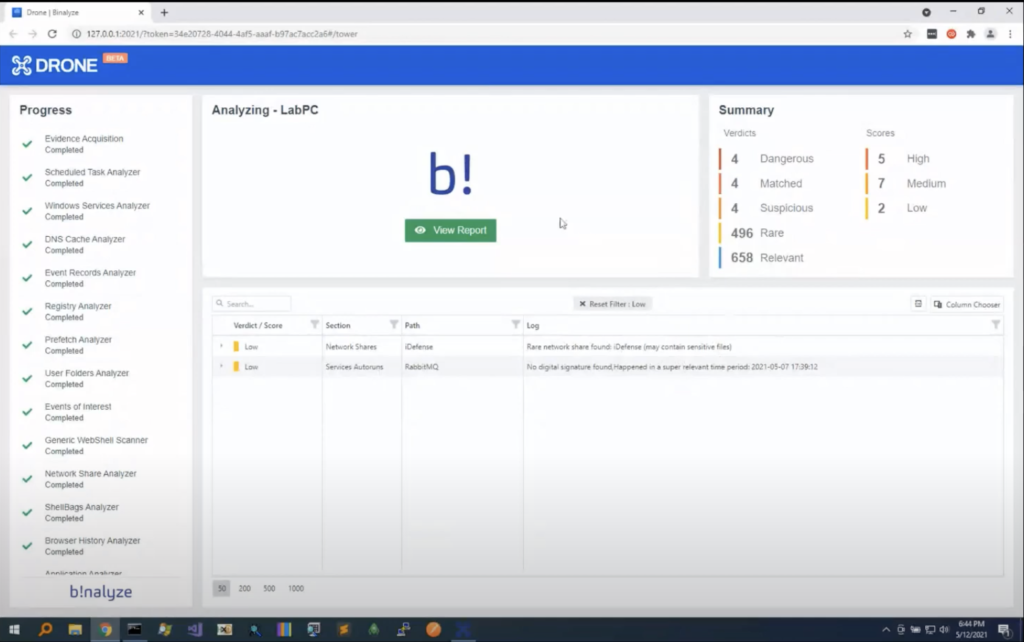
So let’s go back to our investigation. It’s already completed. So in just three minutes, we have all the findings here. Let’s click them one by one. So in the dangerous verdict, we have an attempt to exploit the normal durability. And this was extracted from event log, from using our event log scanner.
And we have a web server artifact. There is a normal web shell. So these are, these have a verdict of dangerous, which is what we should be looking at, for sure. And we were searching for some keywords. As an example, we got a hit in browsing history.
And in the suspicious section, you also have some high entropy web resource, like comm.dll. And we also have some other suspicious events, which states that the event log service was stopped. And we have an outlier file. And as an example, we have prefetched information here, and there are some files that does not have any digital signature, and they’re all executed just once. And the reason this evidence got a high score is because of all these three finding details. So we have a network share here that may contain sensitive files. If it has any active connections, then it will be marked as a medium level finding.
Clicking on the report will immediately take you to the acquisition report. And the difference between AIR and IREC reports is this report comes with all the findings embedded into it. So in this section, we see all the information about findings. And as we see they are grouped here. And clicking on individual sections, you’ll be able to see all the findings, and hovering over them will also show you the individual items in that finding.
As an example, we have like a file here that doesn’t have a digital signature, and the name contains… it looks random. And it’s happened in… we call it super relevant time. So it means it happened in the last few weeks. And all the other sections are again marked with the appropriate findings. And these files are in the acquisition, so we also have some four findings here.
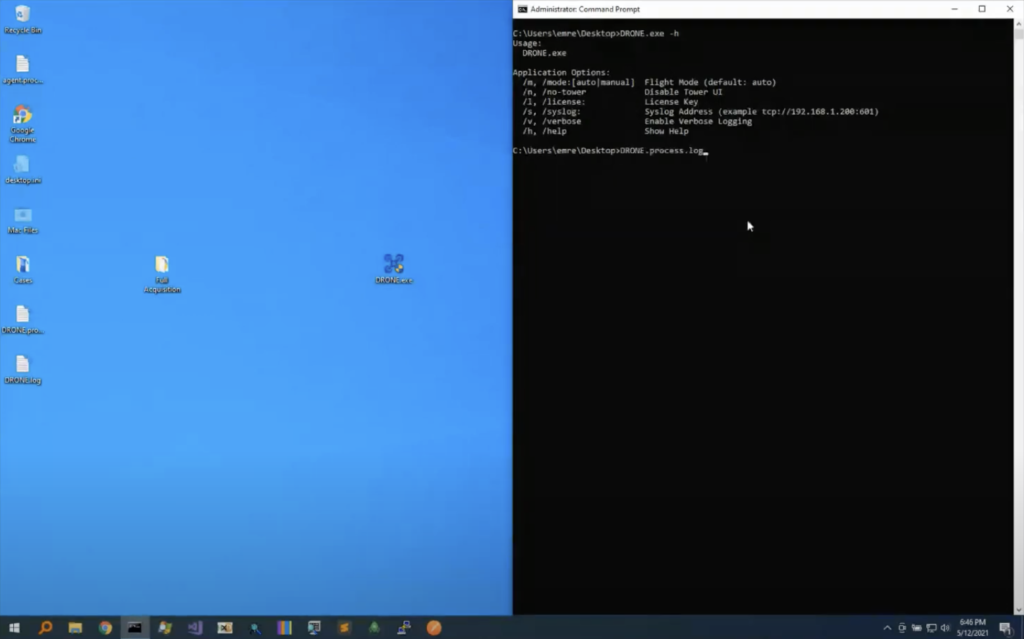
And let’s go back to our slides. Before we get back to the like upcoming features, let me go back to our VM and show you other ways of executing DRONE on an endpoint or on a case file. So DRONE supports command line execution. What you can do is, you can quickly [indecipherable] like command line and typing DRONE here, age option will show you all the parameters. So basically you can select the mode, either auto or manual. The default is auto. And you can ask you not to run a tower UI. So that way all the information will be output to the command line. So this makes it possible to run DRONE using some other third party tool. And that’s what we’ll do now.
And you can also provide information about syslog. So all the findings will be sent immediately to the syslog. So that way you can run DRONE and see all the findings in your cm or any other syslog monitoring solution. So let’s provide -n, so it doesn’t run in power mode, and let’s write the name of it. Running it will immediately output the findings into the command line, and this is a previous made acquisition. So this directory was created when we double click and run DRONE, but now we have an already acquired evidence, so we can provide it. And all the information you see here, as well as being sent to the console, is also saved into both HTML files and JSON files. So in case, if you want to provide this JSON file that contains all the findings to some solution, you can also provide that information to those products. And once the investigation completes, all the information will be saved into the directories.
Now let’s do another way of running it. So dragging and dropping it into DRONE will immediately start Tower. In this case, we already have an acquisition that is created by some other solution, including Binalyze AIR and IREC. So this way, when you click start mission, we will only analyze the evidence without collecting evidence from the end point, because we already have an acquisition. So this way it’s running on the acquired evidence. And as you see, in the blink of an eye, you will see all the findings, like anti-forensic software, some processes that exchange orphan processes, some network shares that are rare to see. And all the information you have seen previously will be immediately highlighted. And it’s almost done: in just 15 to 20 seconds, this will be also completed.
So today we’ll be… I mean, tomorrow we’ll be releasing the first version of DRONE. And we already started working on the new features. The most exciting one is, when you have a case file that contains a well-structured JSON file, like 99% of the time, you’re not required to do any full disc acquisition anymore, except some cases, in case you need to take it to the court. When you have a JSON file, just like the case with Binalyze AIR and IREC, the comparison is much easier, because you’re already looking at a well-structured data. So this way, forensic snapshots, CSV files and JSON files can be quickly compared to another forensic snapshots, CSV, and JSON file.
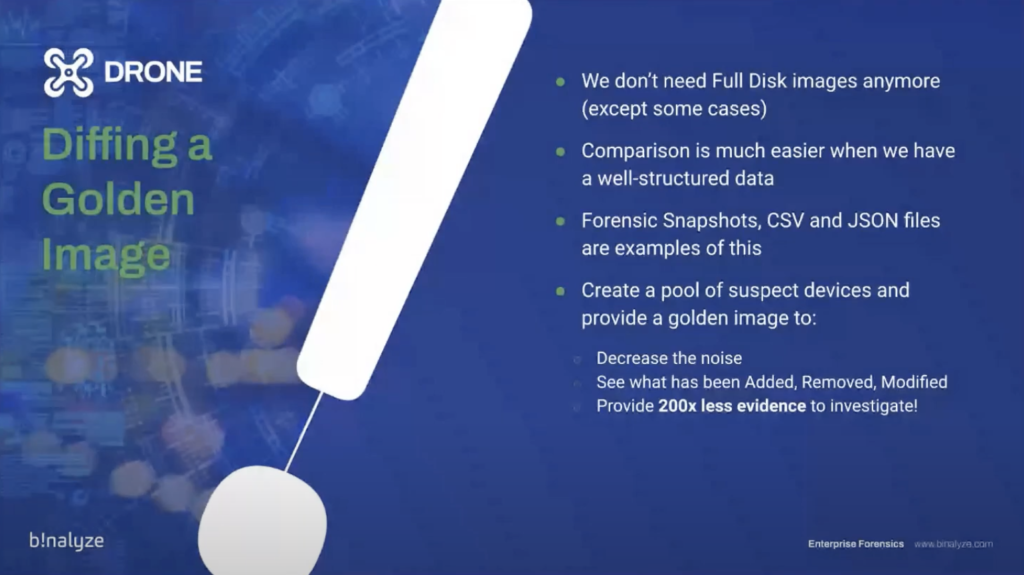
So in the upcoming version, we’ll be adding support for [indecipherable] and acquisition against the golden image; this way you’ll be decreasing the noise and seeing what has been added, removed or modified on that acquisition, based on a golden image. And based on internal tests, it provided 200 times less evidence to investigate, which literally decreases the investigation time to just a few seconds.
We hope you enjoyed it. That’s all about DRONE. I’m now passing the ball to Steve.
Steve: Thanks, Emre. That was really interesting. I hope everybody else found it interesting as well. Before I get into the next steps, if you have any questions, please type them now. I seem to be getting a lot of encouraging emojis, which is great, but if you have any questions, now is the time to ask!
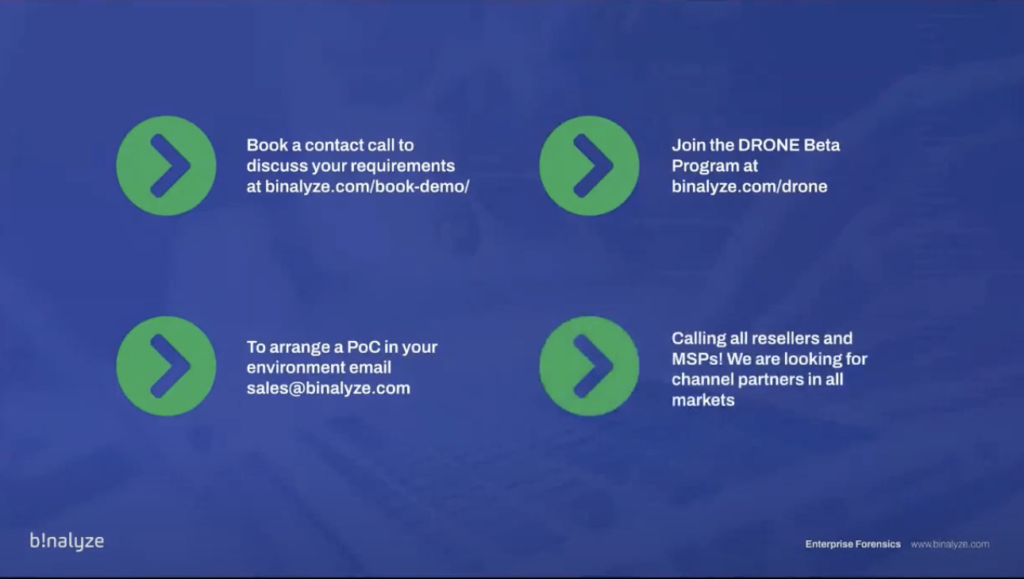
So, next steps. Let’s go through what they are. So if you’ve seen anything today that you think requires a one-to-one conversation, then the best way to do that is to go to binalyze.com and go to the ‘book a demo’ page; that will allow you to select a time slot for us to have the chat. So if that’s appropriate, please go ahead and do so.
As Emre mentioned, the beta program for DRONE will be launching in the morning. So if you’d like to take part in that process, again, please go to binalyze.com/drone, fill in the quick form, and we know who to talk to tomorrow.
If you’d like to arrange a PoC, if you’re sold, please write to sales@binalyze.com. We can kick that process off for you. And also, we are in the process of building out our channel partnerships across the world. So if you are a reseller or you’re an MSSP, please get in touch. We are looking for partners in all major markets.
And so let’s deal with the questions. See what we’ve got. [Indecipherable] Well done Binalyze team. Congratulations. Thank you. [Indecipherable] is one of our board advisors.
How SOC teams can use Binalyze in their operations. Emre, do you want to handle that?
Emre: Sure. Actually, Binalyze is designed to be, in the first place designed, to be used by security operation centers. So they can use it for remotely occurring evidence. They can use it for responding to incident response investigations, and thanks to our latest product, they can also use it to extremely like speed up their process of investigation and end points, and they can do this all in remote fashion. So it’s greater for them, so they can use it in almost every aspect of their incident response process.
Steve: Absolutely. and as I just mentioned, we are looking for MSSP partners who are running outsource socks as well. So if that describes your business, please get in touch.
Another question: is it possible to attach a custom YARA rules to a mission, to a DRONE mission?
Steve: Exactly. Actually what we have done in the demonstration, we have provided the mission using the Tower UI, but mission files can be provided in any format. You can ask DRONE to pull them from some web server. You can provide mission files as a zip file. So what you do is you just combine a drone.exe with a mission file. So that way you can send it to your customers, especially this will be the case for MSSPs. So we can provide a mission by a number of methods, and providing it as a file is one of them.
Steve: Great. are there any plans to support our RSQuery?
Emre: That’s one of the items in our roadmap, so just like YARA and Sigma, in the upcoming versions, we’ll be adding support for RSQuery. So that way… DRONE works in, it also works in [indecipherable] mode. So you don’t need to, you don’t need to run it from some management console because what it does is it turns the end point into an investigation session. So that way it totally comes with an embedded web server. Combining this with RSQuery, you’ll be able to attach some rules to the DRONE as a mission file and then run it and get all the findings into… some can be assist log, or it can be some other product who liked to feed that information into.
Steve: Wonderful. Okay. Have a question from Ben. Hi, Ben, he’s in the UK, I believe. Does the registry acquisition feature capture the entire registry or does it parse selective keys and artifacts? And if it does, can you customize what specifically is captured?
Emre: Great. The registry acquisition works. I mean, it works with the internal driver. So what we do is, we collect all the high files and including the old ones. So when you upgrade a Windows machine, a folder named windows.old is created on the end point, and it may also contain a lot of information, useful information. So we collect the raw evidence files and parse it using an offline registry parser. So that way it doesn’t depend on system calls, which may be problematic. And we also parse the evidence.
So what you have is, you already have the high files, and you also have everything extracted from them. So the answer is yes. And we do a bit more than that. And customize what’s specifically captured is a good question as well. I mean, registry acquisition is really fast in Binalyze AIR and IREC now. So that’s why we didn’t add any selective option there, because when you click registry acquisition, all the high files are collected and well, we may add some customization here, depending on the number of feature requests we receive.
Steve: Great. Okay. Mason says, well done. Thank you, Mason. You know, that means a lot coming from you.
Emre: Thanks a lot, Mason. Mason does all the feature requests!
Steve: He also has a question, but part of the question has turned into an emoji. So you might need to retype it. When will all three products be capable of collecting a master file table from drives other than the smiley face or OS drive? Mason, what’s the smiley face? No, the C drive! The C drive or OS drive.
Emre: Yeah, I know what you mean. Actually, we were quite busy implementing all the features Mason and his team was asking. So in the upcoming versions, we will be working with, it’s a priority now. So it will be on the way.
Steve: Okay. And it’s a question from Charla. Can we run DRONE on offline disc images, like other forensic software?
Emre: Great question. So actually we were trying to stay away from like e01 and l01, because we take it as the traditional way of doing stuff. But as long as you have a method of mounting that into your workstation — like, there are a number of ways to do this. So after you mount the image in your workstation, you can still use DRONE as a post processor. But if you’re asking about, if it will be supporting evidence extraction from like, e01 and l01, we won’t be supporting it natively, but it doesn’t mean that you cannot use DRONE for investigating evidence that is collected as an e01 file. You can still map it and use DRONE for analyzing the evidence.
Steve: Okay. Thanks, Charla. Question here. Do you support Mac OS? We hear that a lot.
Emre: Oh, before that, Steve, we also have another one, like the golden image part. So actually golden image comparison is a long time dream of our team. I remember talking about it like almost five years ago. Yeah. Because when you have a ground truth, it becomes really easy to see what has changed, or what has added or removed from that image. Previously was not possible because even when you compare a byte stream, I mean, if they’re in the right place then it may be a bit easy, but if you have a lot of modifications, then it becomes really hard.
In our case, we are not comparing a bytestream, we already have a well structured JSON file that is acquired by an end point. And if you collect evidence from a golden image, or provide the golden image that was collected in the past, you’ll be able to quickly take out all the evidence that needs to be there. And that way you will be able to focus on what has changed, modified, added, or removed. So that that’s how it will work. And it’s really exciting because it really decreases the investigation time to minutes.
Steve: Wonderful. Nicely sidestepping the Mac question as well, so I’ll ask it again. Do you support Mac OS?
Emre: Actually, Mac was not a priority because we are completely focused on enterprise forensics. We love Mac. I mean, you’re also developing the products in Mac. So it will be supported by the end of this year. And actually, we have taken a step forward for this: with the latest releases of AIR, we have added support for Linux boxes, and our endpoint agent is cross-platform. So we’ll just put more effort into Mac soon, and we’ll do our best to finish it by the end of this year.
Steve: Wonderful, good news. And a question from [indecipherable]. How can we prove the evidence collected by DRONE in legal terms? I guess he means…
Emre: That’s a [indecipherable] point, because when it comes to traditional forensics, what you need to do is you take the focus image and you get a hash off that image. Most of the time, you need to have separate copies of that image. One is handed over to the suspect and the other one is taken to the department, but in more than incident response, I mean, this is true for law enforcement. So if you want to take the investigation to court and you need this, but 99% of the time, you’re not even interested into like, talking about that investigation the other day. So, our solutions are helping our customers to immediately, in the least amount of time possible, understand what may have gone wrong on the endpoint.
And it’s actually a problem that does not have a solution now, because when it comes to volatile evidence, volatile evidence won’t have changed in any time. So it’s not like the deadbox forensics. In deadbox process, you just turn off the machine, and as long as you preserve the hardware, whatever you have in the hardware will still be there, but that’s not the case in REM, or the volatile evidence.
So for this, for advertising this need, we have added timestamping. That way, when you acquire evidence with IREC, you also have a timestamp of the evidence. So you can prove that that specific evidence existed at that specific time, but this is not for the court. This is just for proving the timestamp of the evidence.
Steve: We do have some interesting developments, which we’ll be announcing probably next month in this area, in terms of the the chain of custody, in terms of the evidence. So watch this space on that. There’ll be some exciting news in that area.
Another question from Mason: frequently in ransomware incidents, we end up having to mount a VM DK — that’s the OS drive with the effective machine — to another device, and then pointing our collection tool at the drive letter to collect from it. Will we get the capability to designate a drive letter as the OS disc?
Emre: If Mason asks it!
[laughter]Emre: And by the way, for those who doesn’t know who Mason is, Mason is… they are working… I think they’re handling almost like more than 2,500 cases a year in the US. So that’s why they’re getting these high quality questions. It’s not a priority right now, but we can consider adding this. I like the idea of mounting it the NBK, and then collecting evidence from it. As long as we know the password. So it can be considered, but it wouldn’t be right to provide a like, ETA for that.
Steve: Okay. That wraps up.
Emre: Thank you, Mason.
Steve: Yeah. Thank you, Mason, and everybody else has asked their questions as well. That wraps up all the questions, I think. So thank you everyone for your time. We’re just slightly over the hour. Hopefully you found the content interesting. If you’d like to get your hands on the product, please go to binalyze.com/drone, and we will be distributing that tomorrow. And we hope to speak to you all again soon. Thank you.
Emre: Thanks a lot, everyone.