We set out on a journey to devise a more intuitive design with improved navigation, visuals, and tools to optimize UFED Physical Analyzer to help you save valuable time and get the job done accurately. Now you can find evidence faster than ever before. UFED Physical Analyzer version 7.3.3 is the most substantial upgrade to this user interface we’ve ever done.
This enhanced UI provides a number of useful new features, while improving accessibility to data from extracted devices. We’ve accomplished this by adding a navigation bar to tree, which allows you to search models in the project tree. We’ve also added a time bar to graphically view extracted phone data. Together, these new additions optimize the examination process downstream.
In this getting started movie, we will review the main changes and enhancements introduced to this new PA version, proving you some clear guidelines on how to quickly start using this new version.
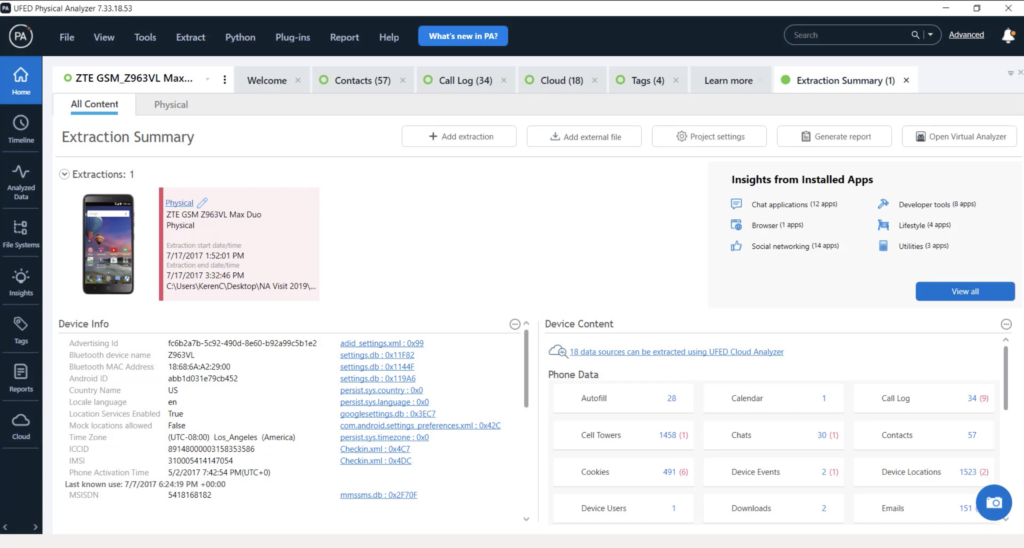
As you can see, we have a new user interface. We have taken the user interface and the user experience of Physical Analyzer to a new level, with a new UI that is more intuitive and convenient. Let’s take a closer look at the changes of the new UI.
There are some color changes and a new design in the top menu bar. The menu options are just the same. On the left, we have a new navigation pane. We have basically taken the busy and extensive project tree and divided it to several sections, providing you a much better navigation journey, getting into data faster, and reducing the need to scroll up and down.
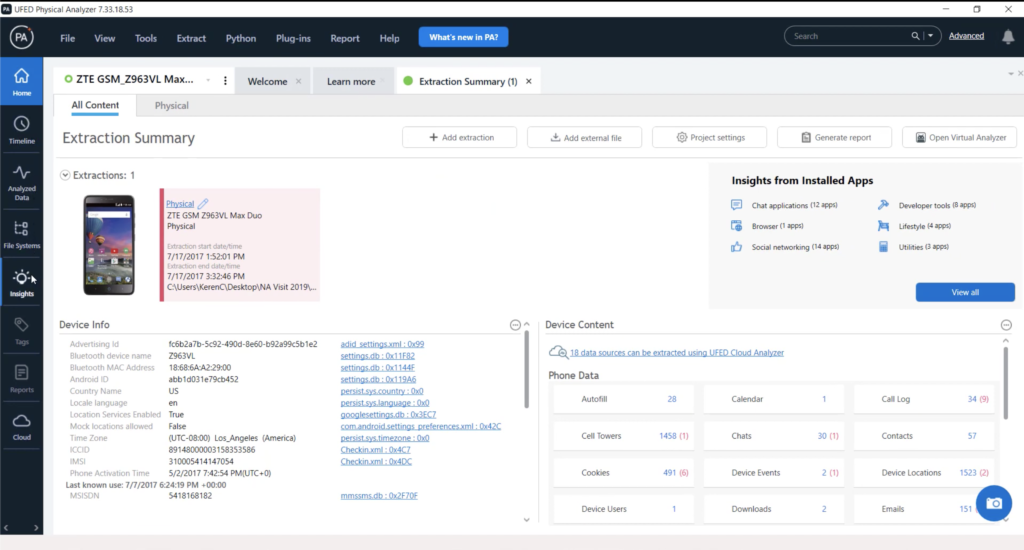
Let’s start with home. Here, you can see the extraction summary view that you are familiar with. The extraction summary tab is displayed automatically whenever you open a new extraction for analysis. A few additional small yet very important enhancements include new menu items that are shown in a kebab style. Kebab buttons were added to the project tree to enable you to perform operations on active projects, trees, and tables. This kebab button displays all operations on the project that were available in the old project tree — the other right click — for example, add extraction; add external file; rename active project; and close active project.
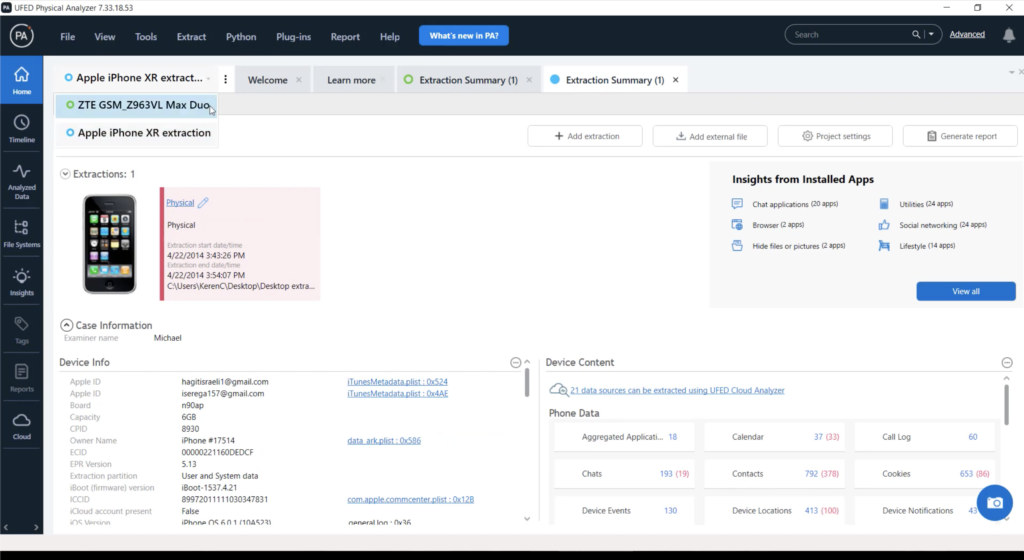
You can open many projects like in previous versions of Physical Analyzers, all are gathered in this view and you can click the dropdown menu to switch between projects.
Now let’s take a look at the timeline. The timeline view is a true storyteller that enables examiners to see a sequence of time-related events. Visually a lot of you start by reviewing the timeline view. Now you can easily navigate into the timeline view, which is just below the home button.
In this version, the timeline is enhanced with a new graphical time bar. The time bar helps to focus on the extracted data and put it within a crime timeframe. This addition is super powerful for the timeline view. Now you can see any event with a timestamp and quickly view trends, volume of activities, and more. You can also zoom in on the time bar using the mouse or the scroll bar below the time bar.
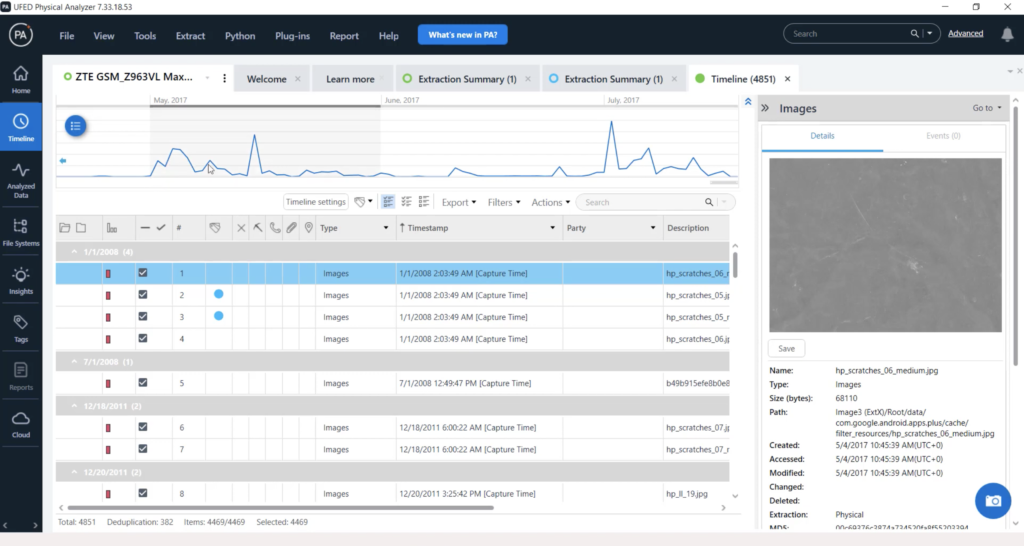
You can select the date range of interests and easily filter the data on the fly visually, by clicking ‘apply’ button. As a result, events on the table will be filtered accordingly. The table and the time bar are both synced to the data shown, so you can filter information from graph to table, and the other way around.
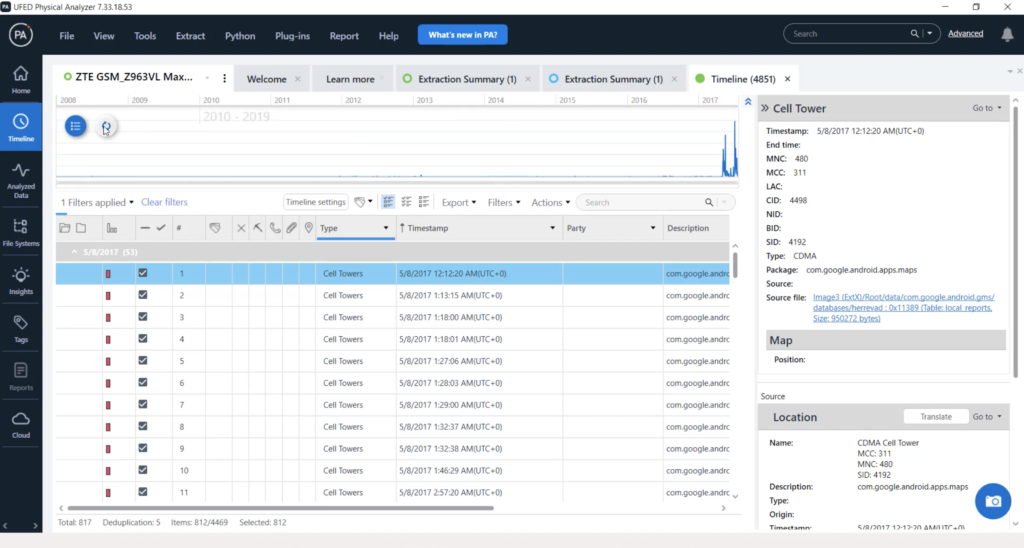
By clicking this toggle bar filter, you can select the type of events and the relevant timestamps to be displayed in a time bar. Each event timestamp will have its own line and color.
Let’s jump to the analyzed data. We unified the analyzed data and data files under this navigation option. All extraction data can be found here. All the tables are now grouped into different categories to help unify related events data.
Data on the same type will be found under the same category. For example, under the media category, you can find images, videos, and audio. To find data faster, we added a search option in the tree. The search is performed on all the models within the tree, while search results display only models containing the string that you were looking for.
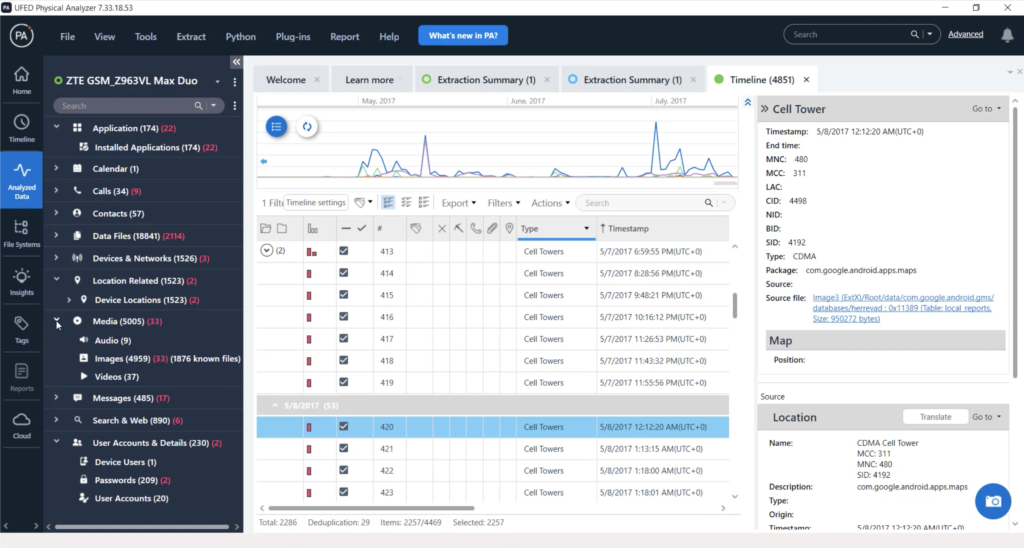
This kebab button displays all operations on tree and tables that existed above the old project tree in previous versions of Physical Analyzer, such as expand all, collapse all, select items for report, and unselect items for report.
Under the file system, you can find the file system tree item lists, including the binary images. The insights is a new section, and a very important one. Here, you can find important insights for your case, such as malware scanner results, hash set results, and more will be added in the near future.
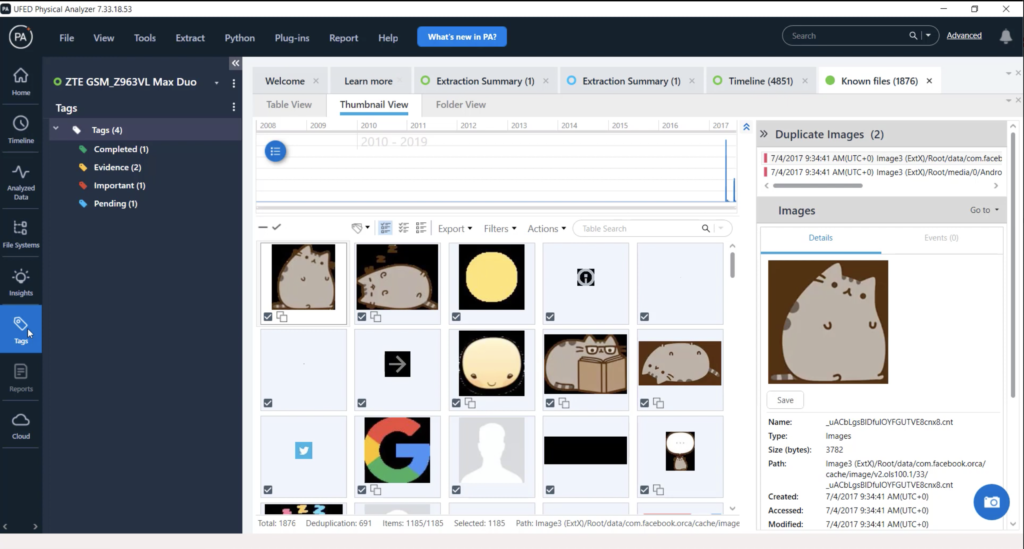
Finding important information and creating tags is a capability every examiner and investigator uses. Any tagged items will be presented here, including hex tags, enabling fast access to tagged items.
Under reports, you can find a list reports which were already generated for the project and additional files added, like screen capture and external files will also be shown here.
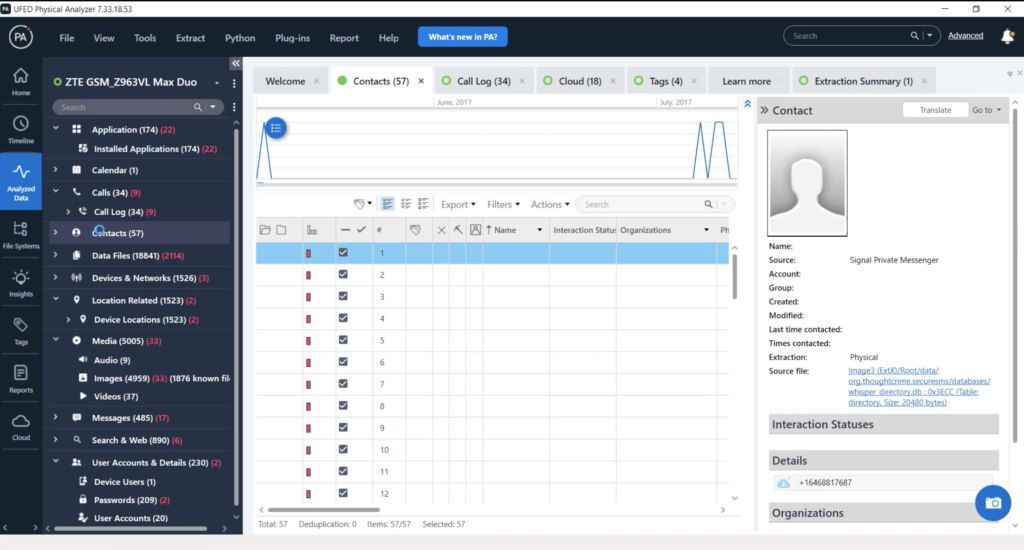
Finally, cloud. This option provides cloud insights, including cloud tokens, available on the device.
All of these exciting changes — and more to come — have been made to improve the user experience for examiners and help focus data review, search and analysis, make it faster and more convenient. With the valuable addition of the time bar, the simplification of the navigation journey, and the actionable insights that can be generated, the new and enhanced UFED Physical Analyzer is the best tool available for investigative teams.


