Determining whether a driver’s actions were intentional or accidental is a common question investigators use vehicle data to answer. When a vehicular fatality occurs, can differences in driver behavior be used to establish intent?
In a recent case in the UK, an Amazon delivery driver had his van stolen while making a delivery. As the suspect sped away, the driver held onto the door and was dragged down the street before being thrown from the vehicle and killed. Investigators initially struggled to prove whether the suspect’s driving behavior was a deliberate attempt to dislodge the victim. Using iVe, they analyzed velocity logs and related driving events, identifying sudden and significant changes in speeds consistent with intentional actions. This evidence ultimately elevated the charge from manslaughter to first-degree murder.
In this article, we will demonstrate how velocity logs, associated hard braking, and hard acceleration events can be used to analyze driving behavior helping to answer questions such as:
- Was this an isolated event from their normal driving behavior?
- Was this a recurring pattern of reckless driving over time?
- Does the data indicate the driver could have been under the influence?
To demonstrate, our team conducted a controlled drive to a predetermined destination and then returned to Berla HQ along the exact same route. They intentionally contrasted their driving patterns on each leg of the trip.
The vehicle used was a 2026 Hyundai Kona, equipped with a ccNC system, which logs vehicle velocity, hard braking and hard acceleration events.
Our objective was to use these data points to compare the driving patterns of each segment of the trip, to see how the data can indicate distinct changes or differences in driving behavior.
Establish Knowns
What we know is that the vehicle departed Berla HQ at 06:17, drove to the predetermined route and returned along the same route at 06:48. What we do not know is if and how the driving behavior differed between each trip.
Before beginning the analysis, we documented baselines along the route for our analysis. We identified three primary roadway segments and noted the speed limit, roadway type, and traffic controls for each segment.
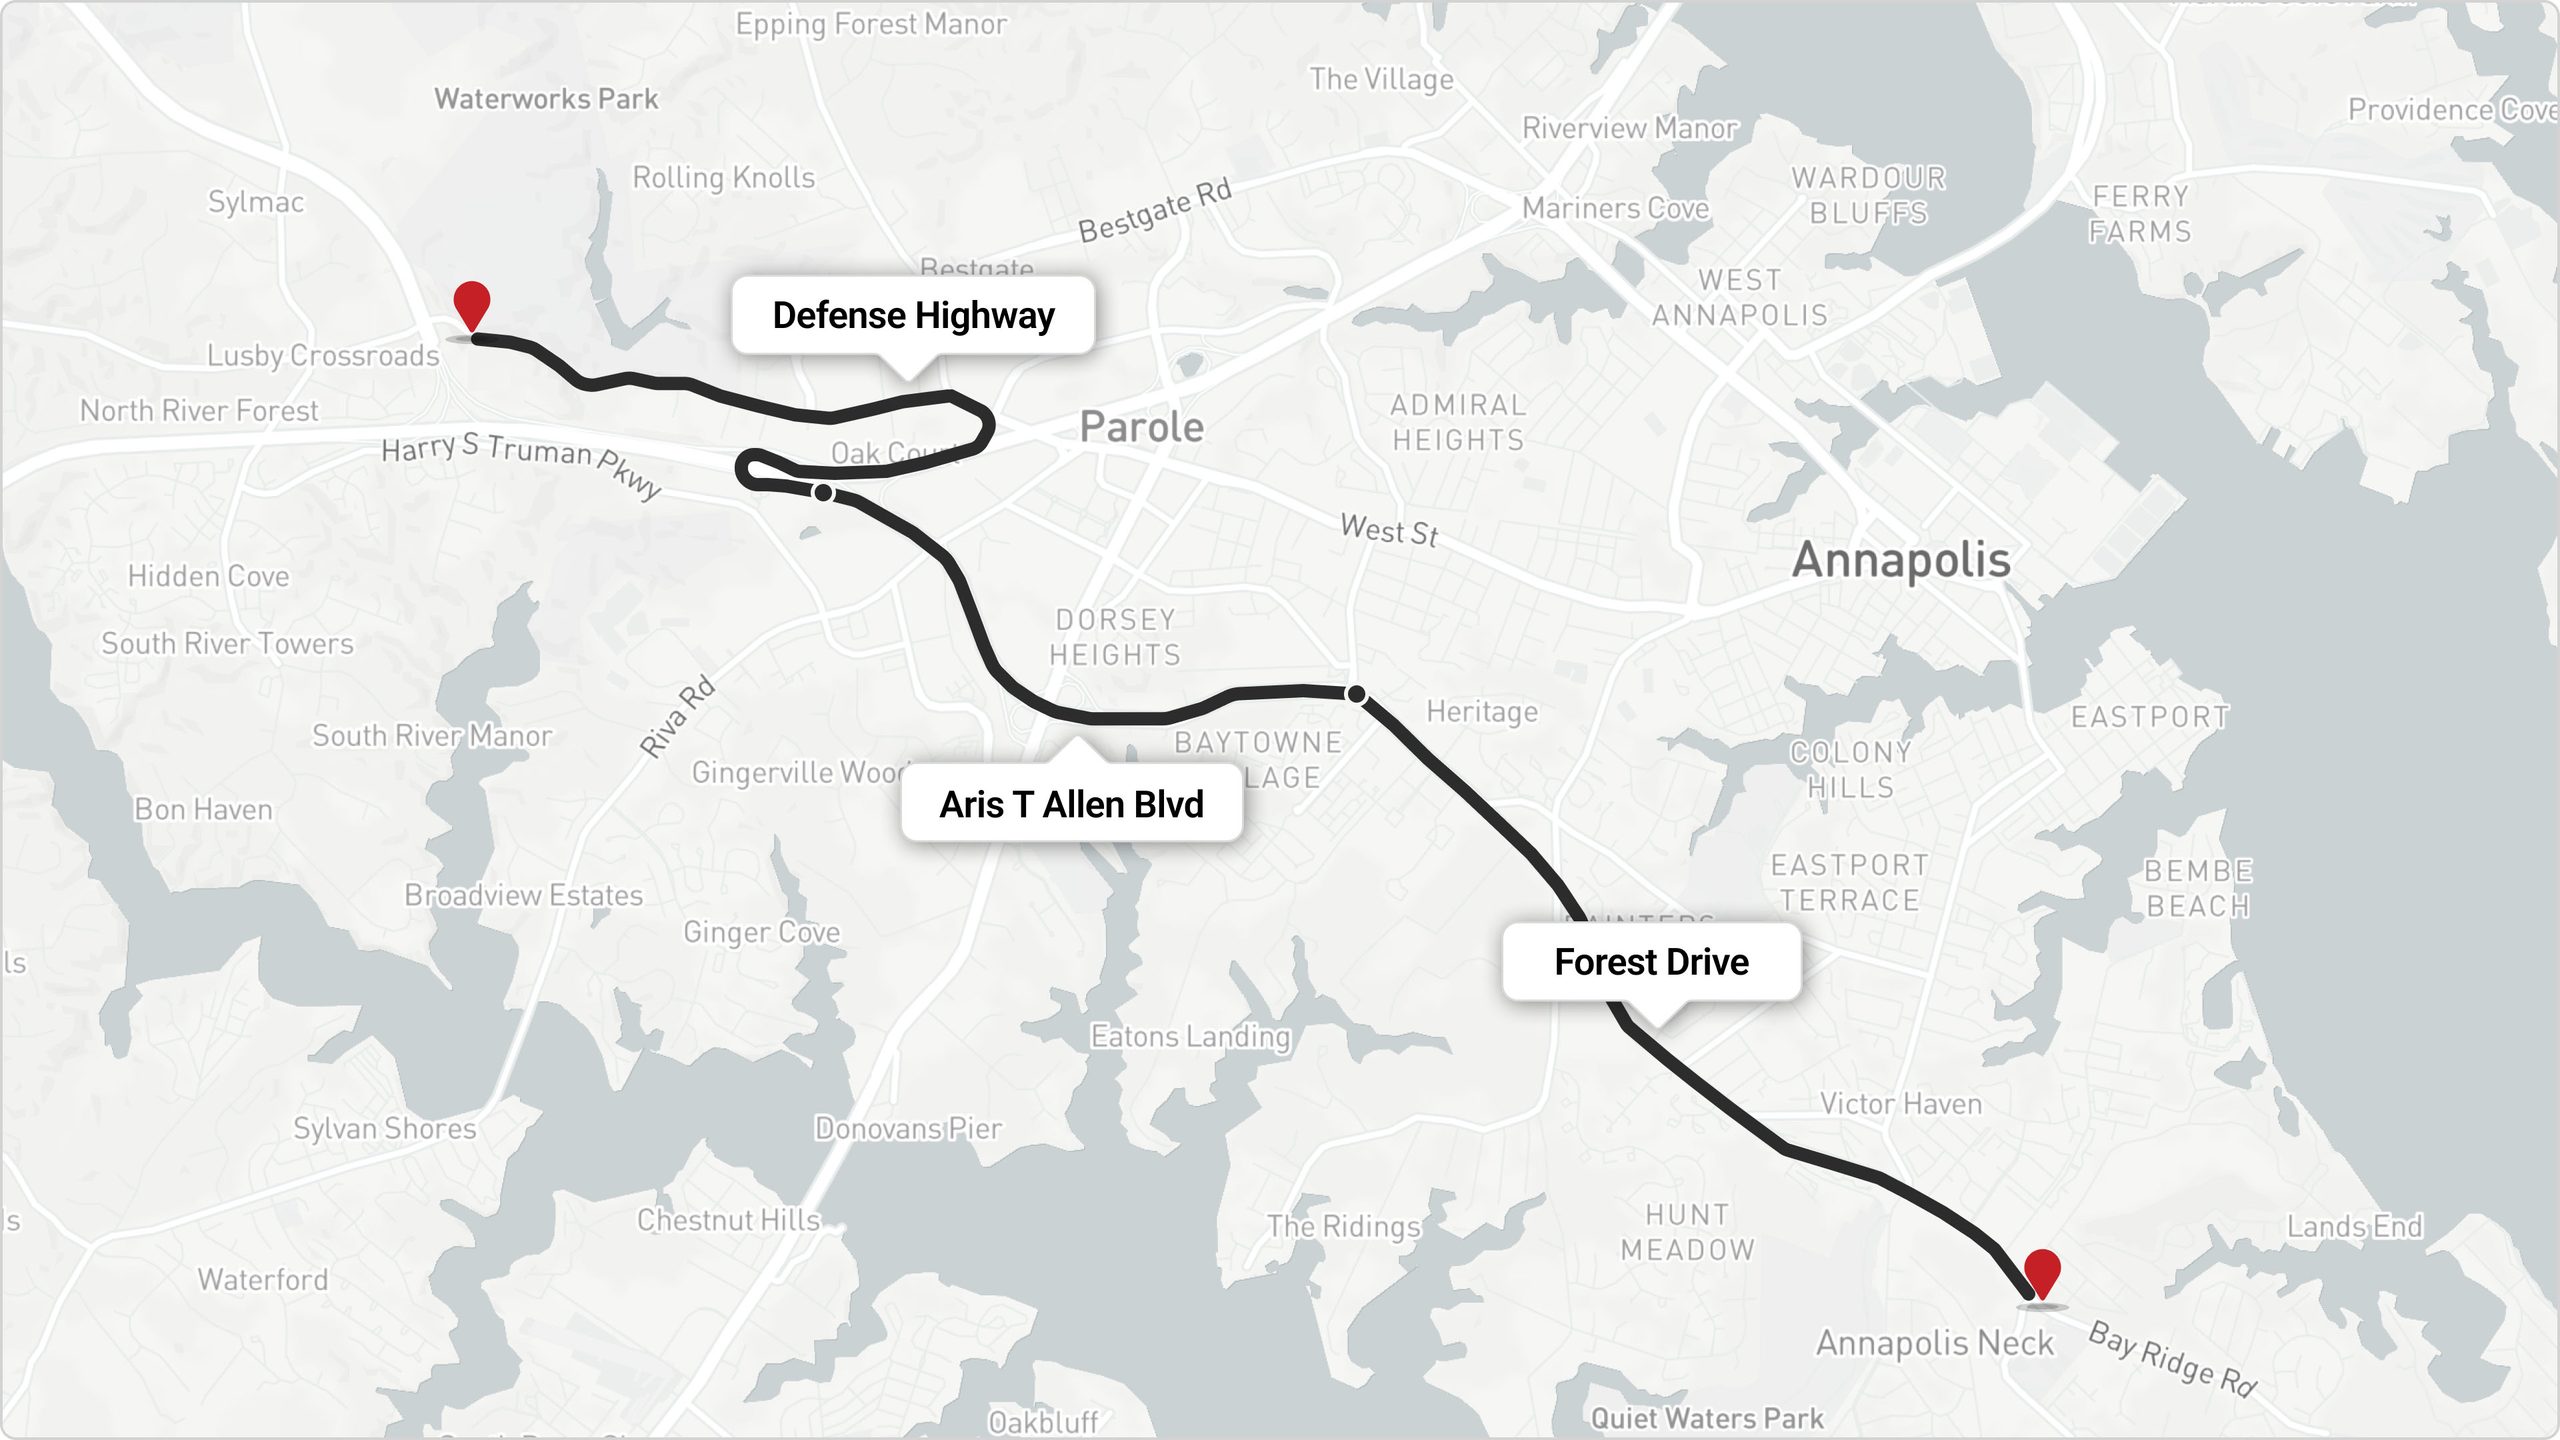
1. Forest Drive
- Speed Limit: 40 mph
- Roadway Type: Urban, congested
- Traffic Controls: High concentration of traffic signals and intersections; designated school zone
2. Aris T. Allen Boulevard
- Speed Limit: 55 mph
- Roadway Type: Divided highway
- Traffic Controls: No traffic signals
3. Defense Highway (SR 450)
- Speed Limit: 35 mph
- Roadway Type: Urban, winding road with narrow shoulders
- Traffic Flow: Low concentration of traffic signals
Trip Overview
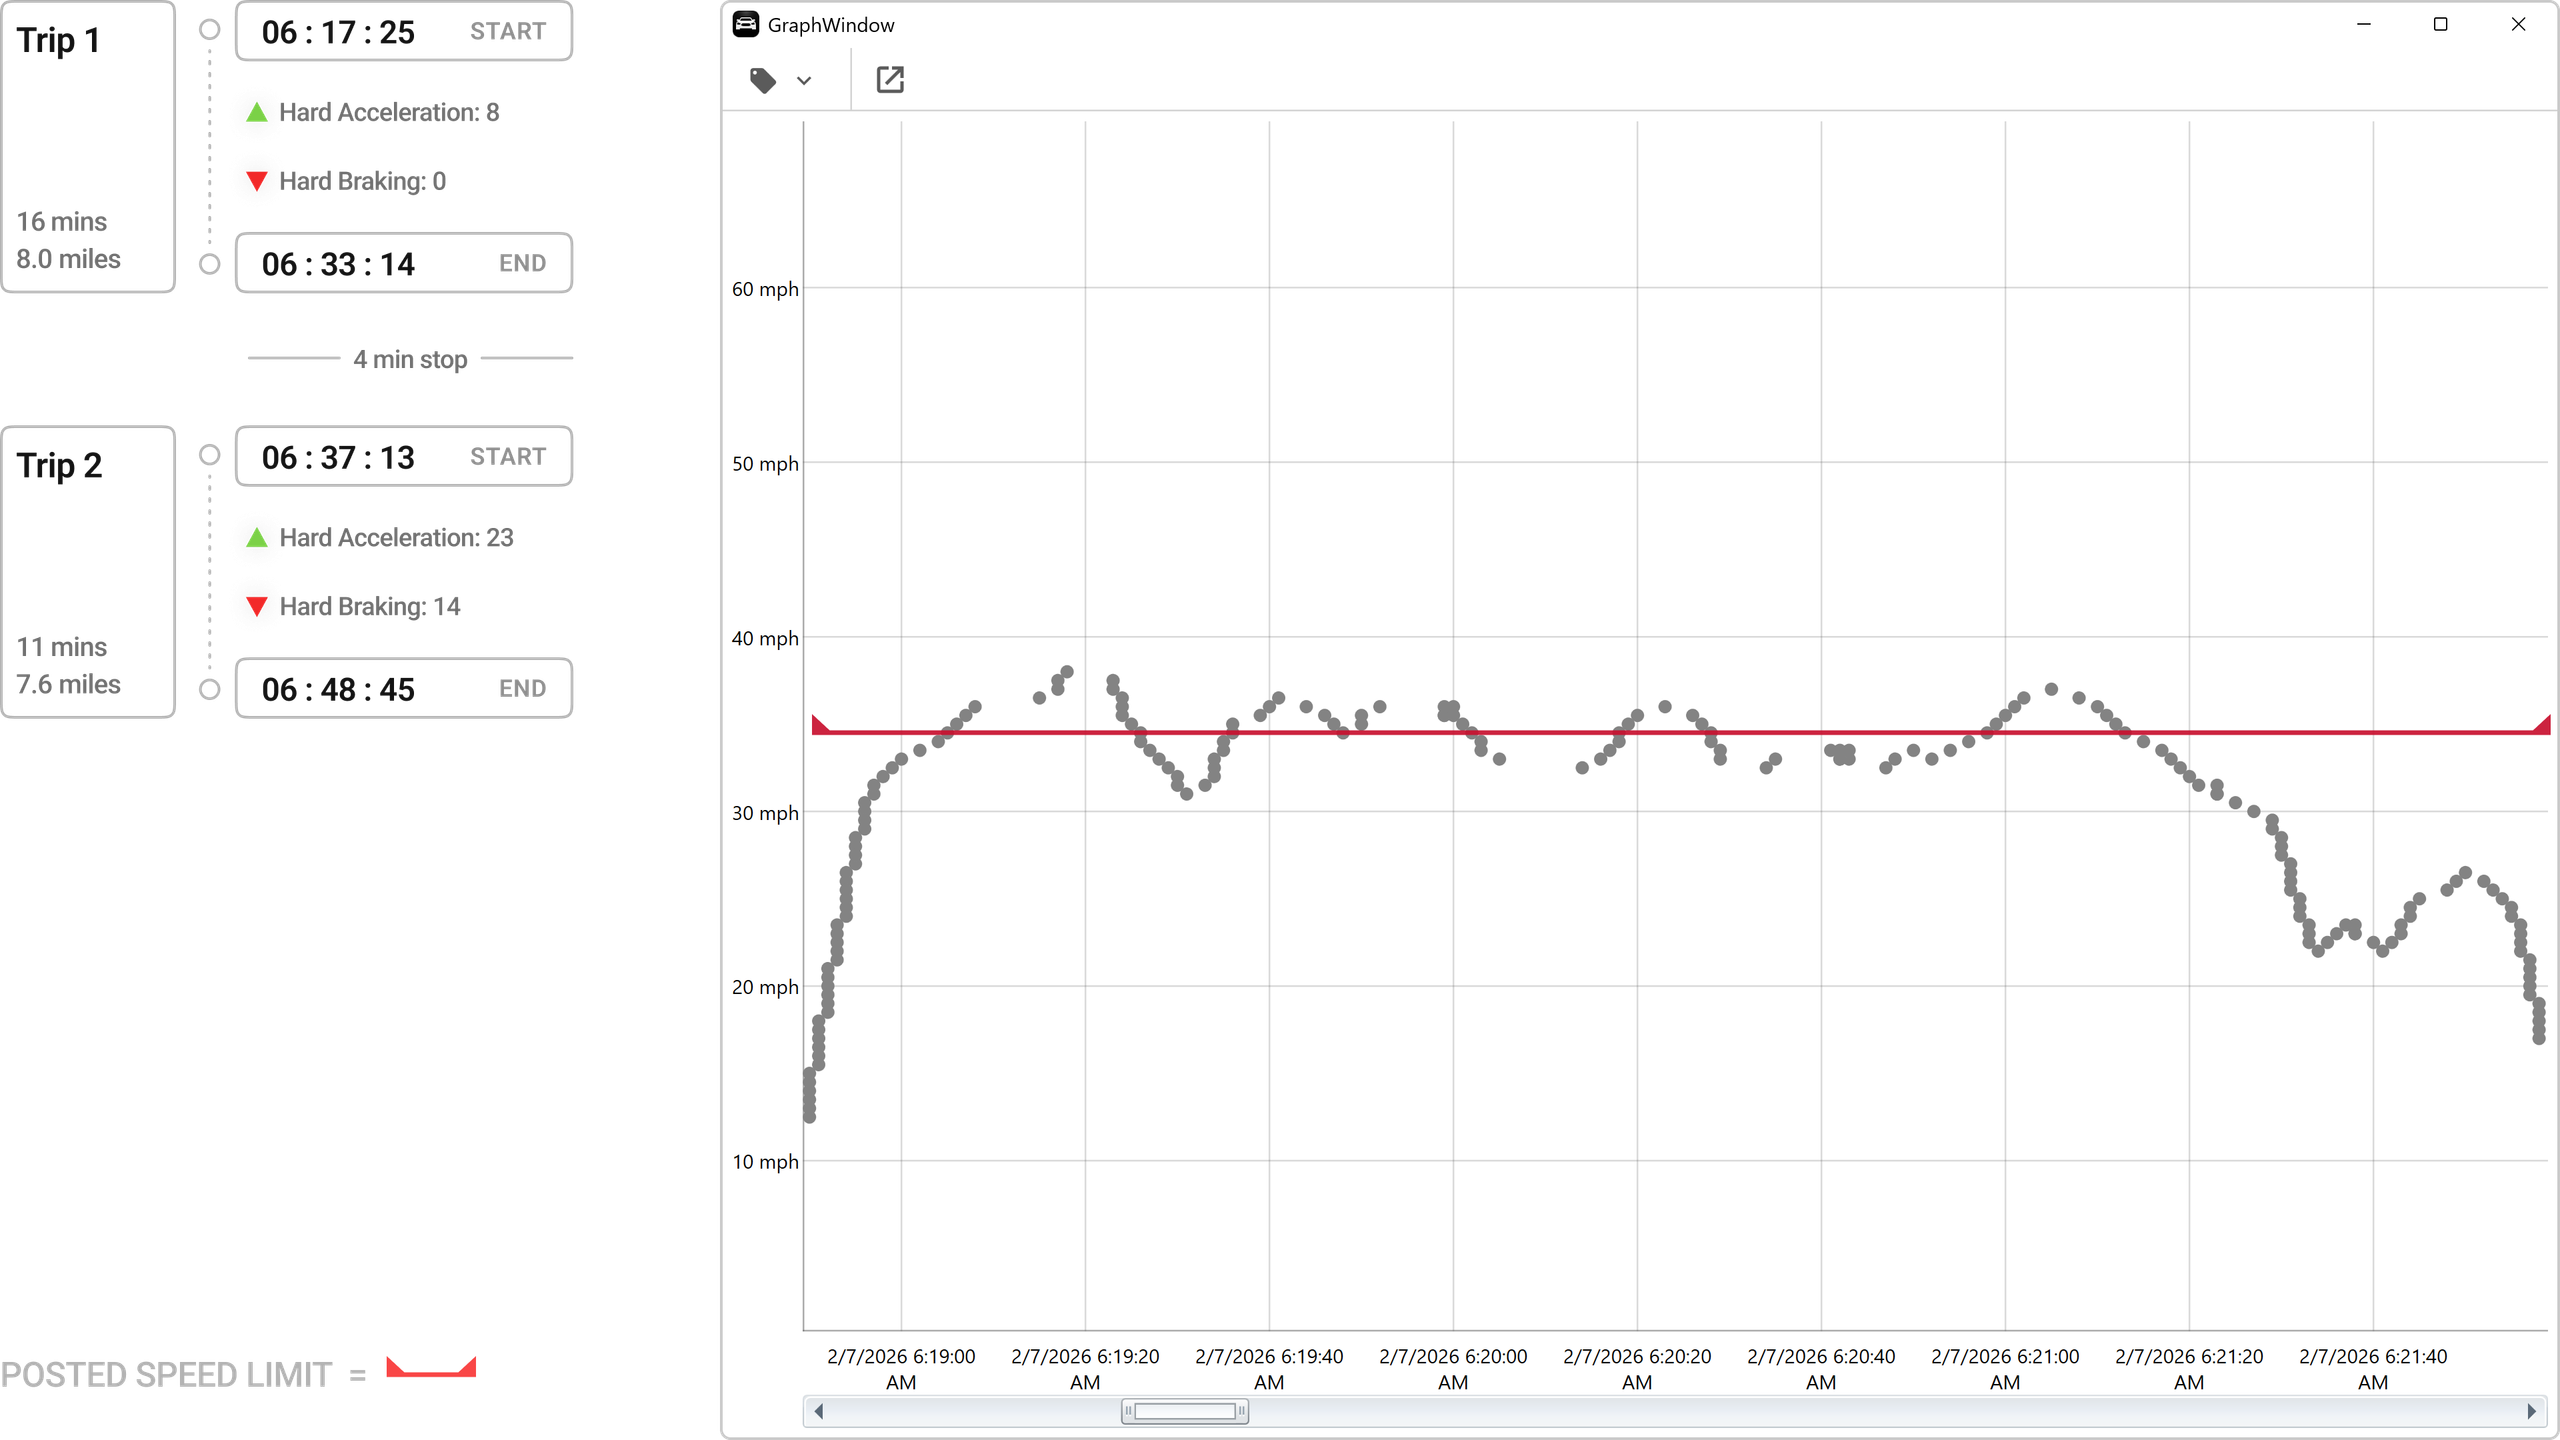
Now that we have our timeframe and baseline information, we used the data we acquired from the vehicle to isolate the velocity log for the time period. It revealed two distinct driving trips separated by a stop in vehicle activity.
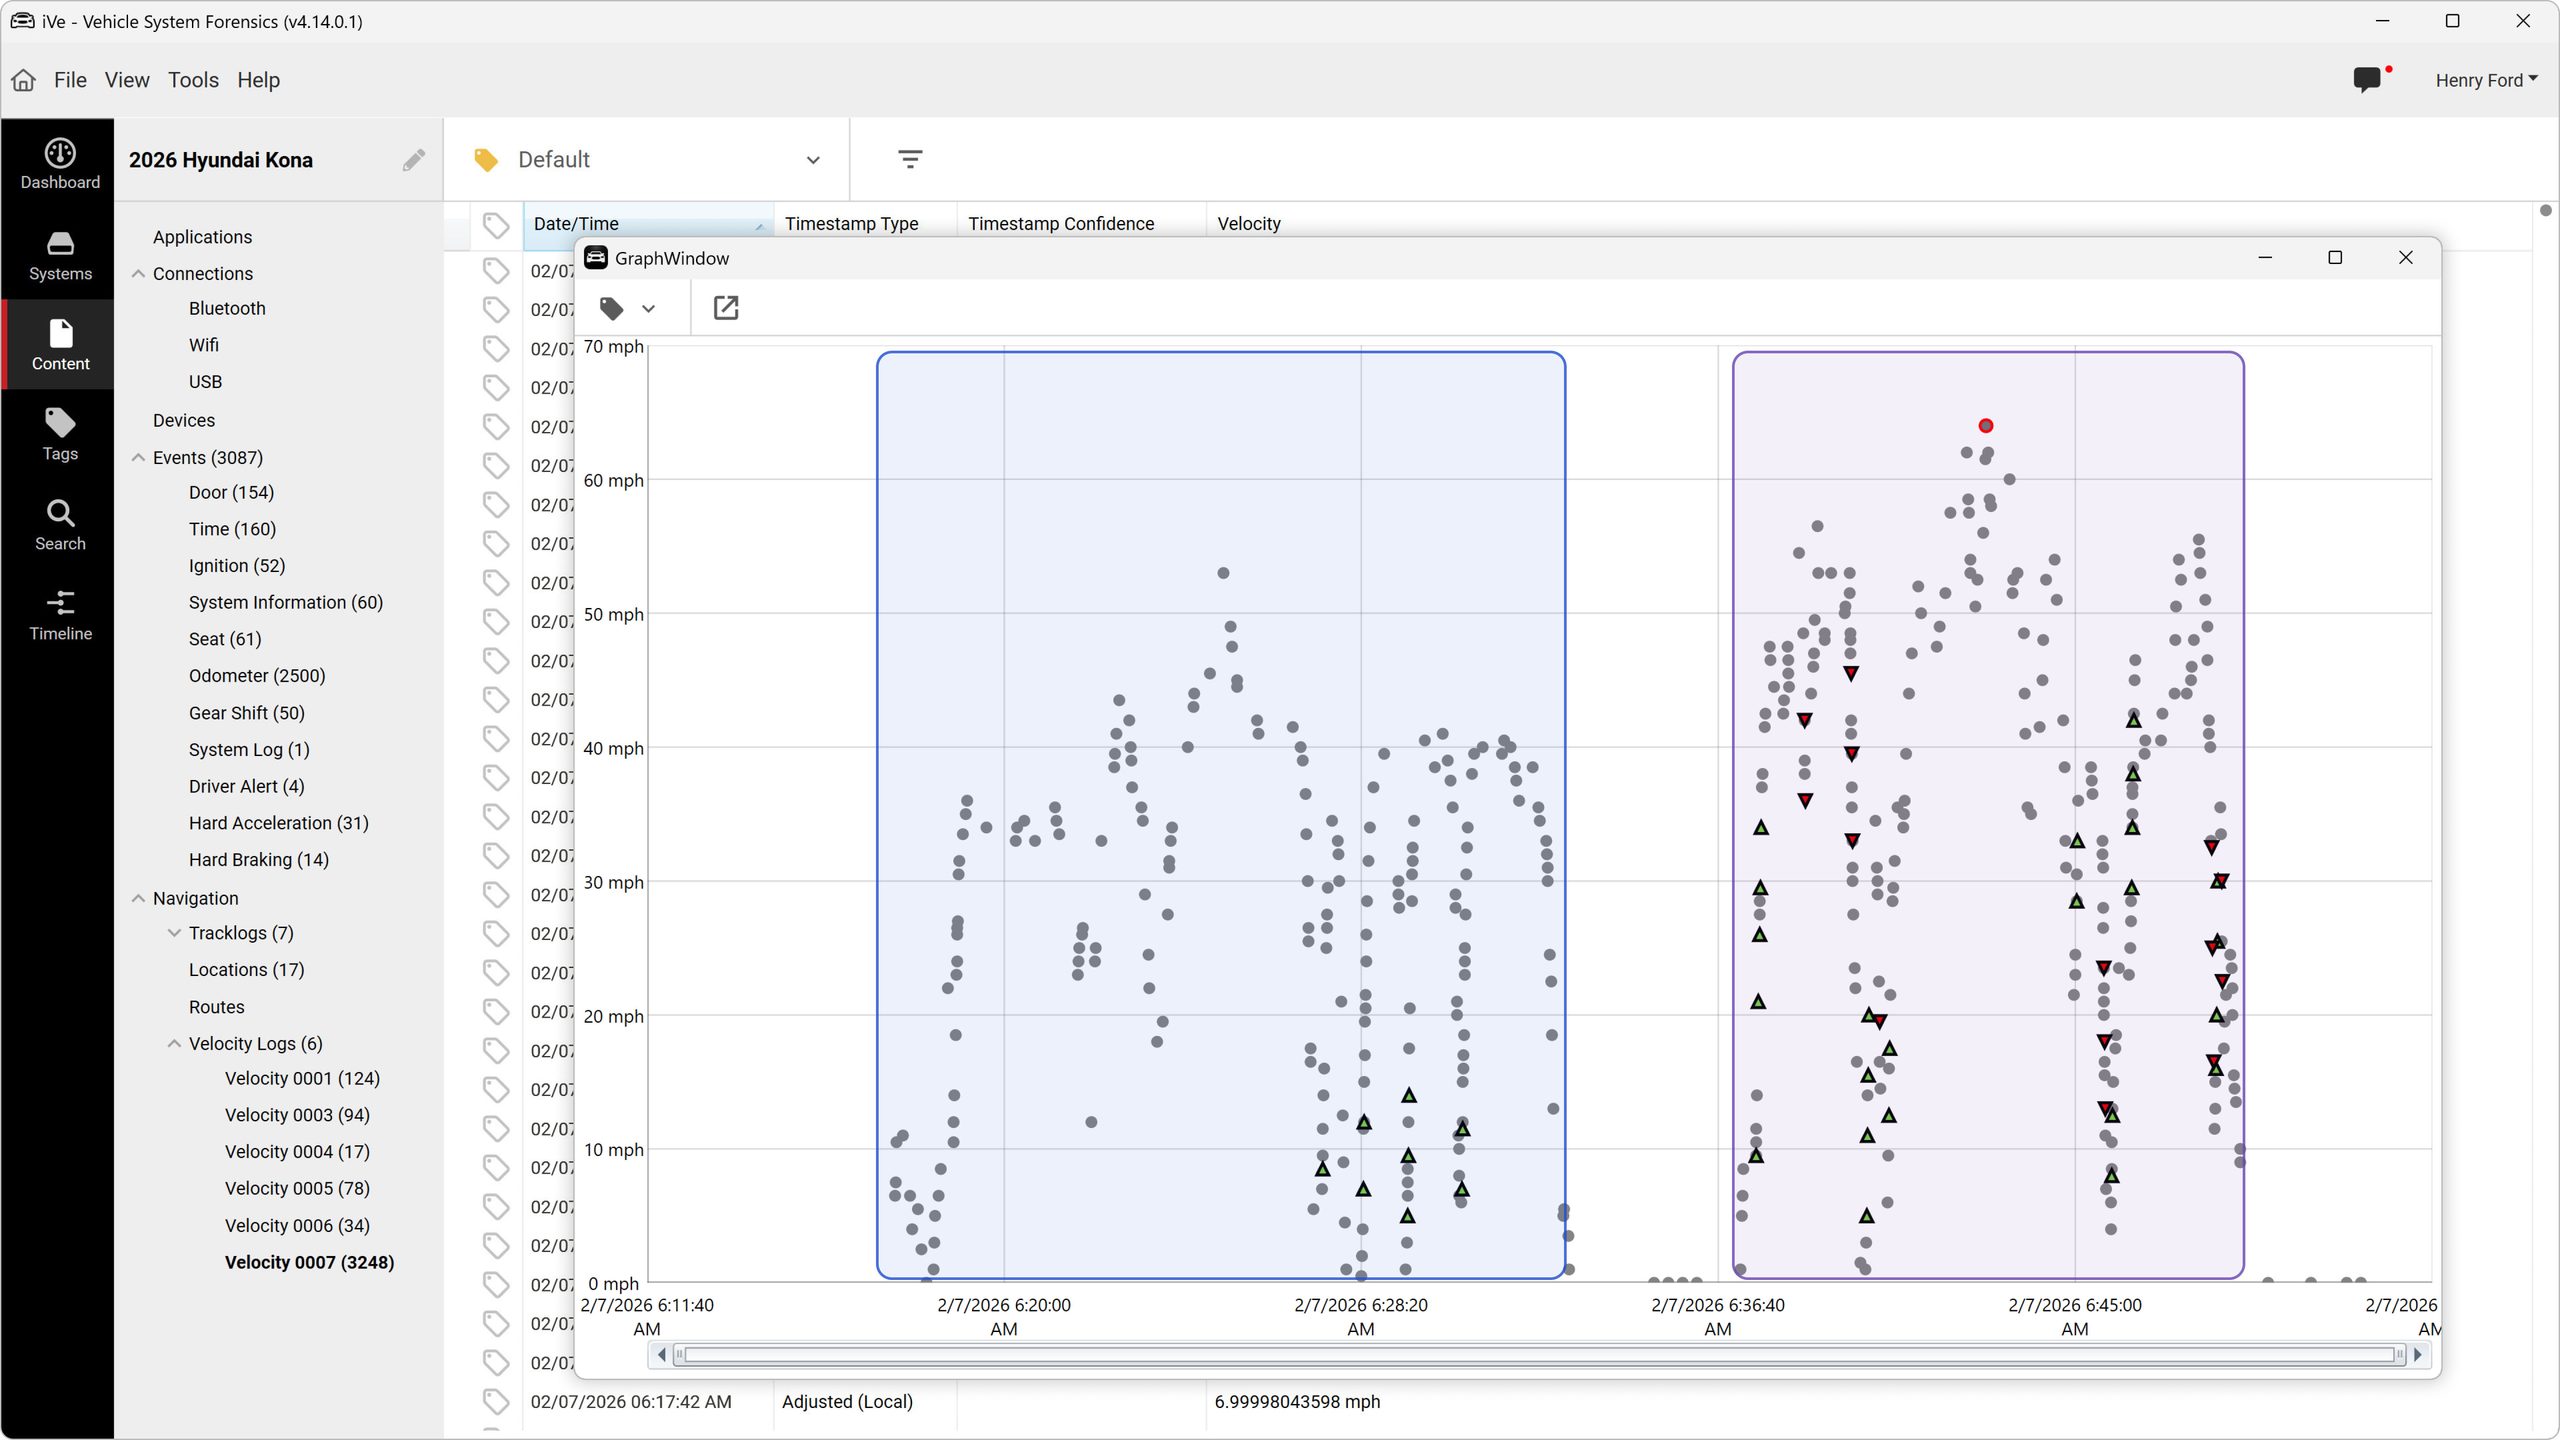
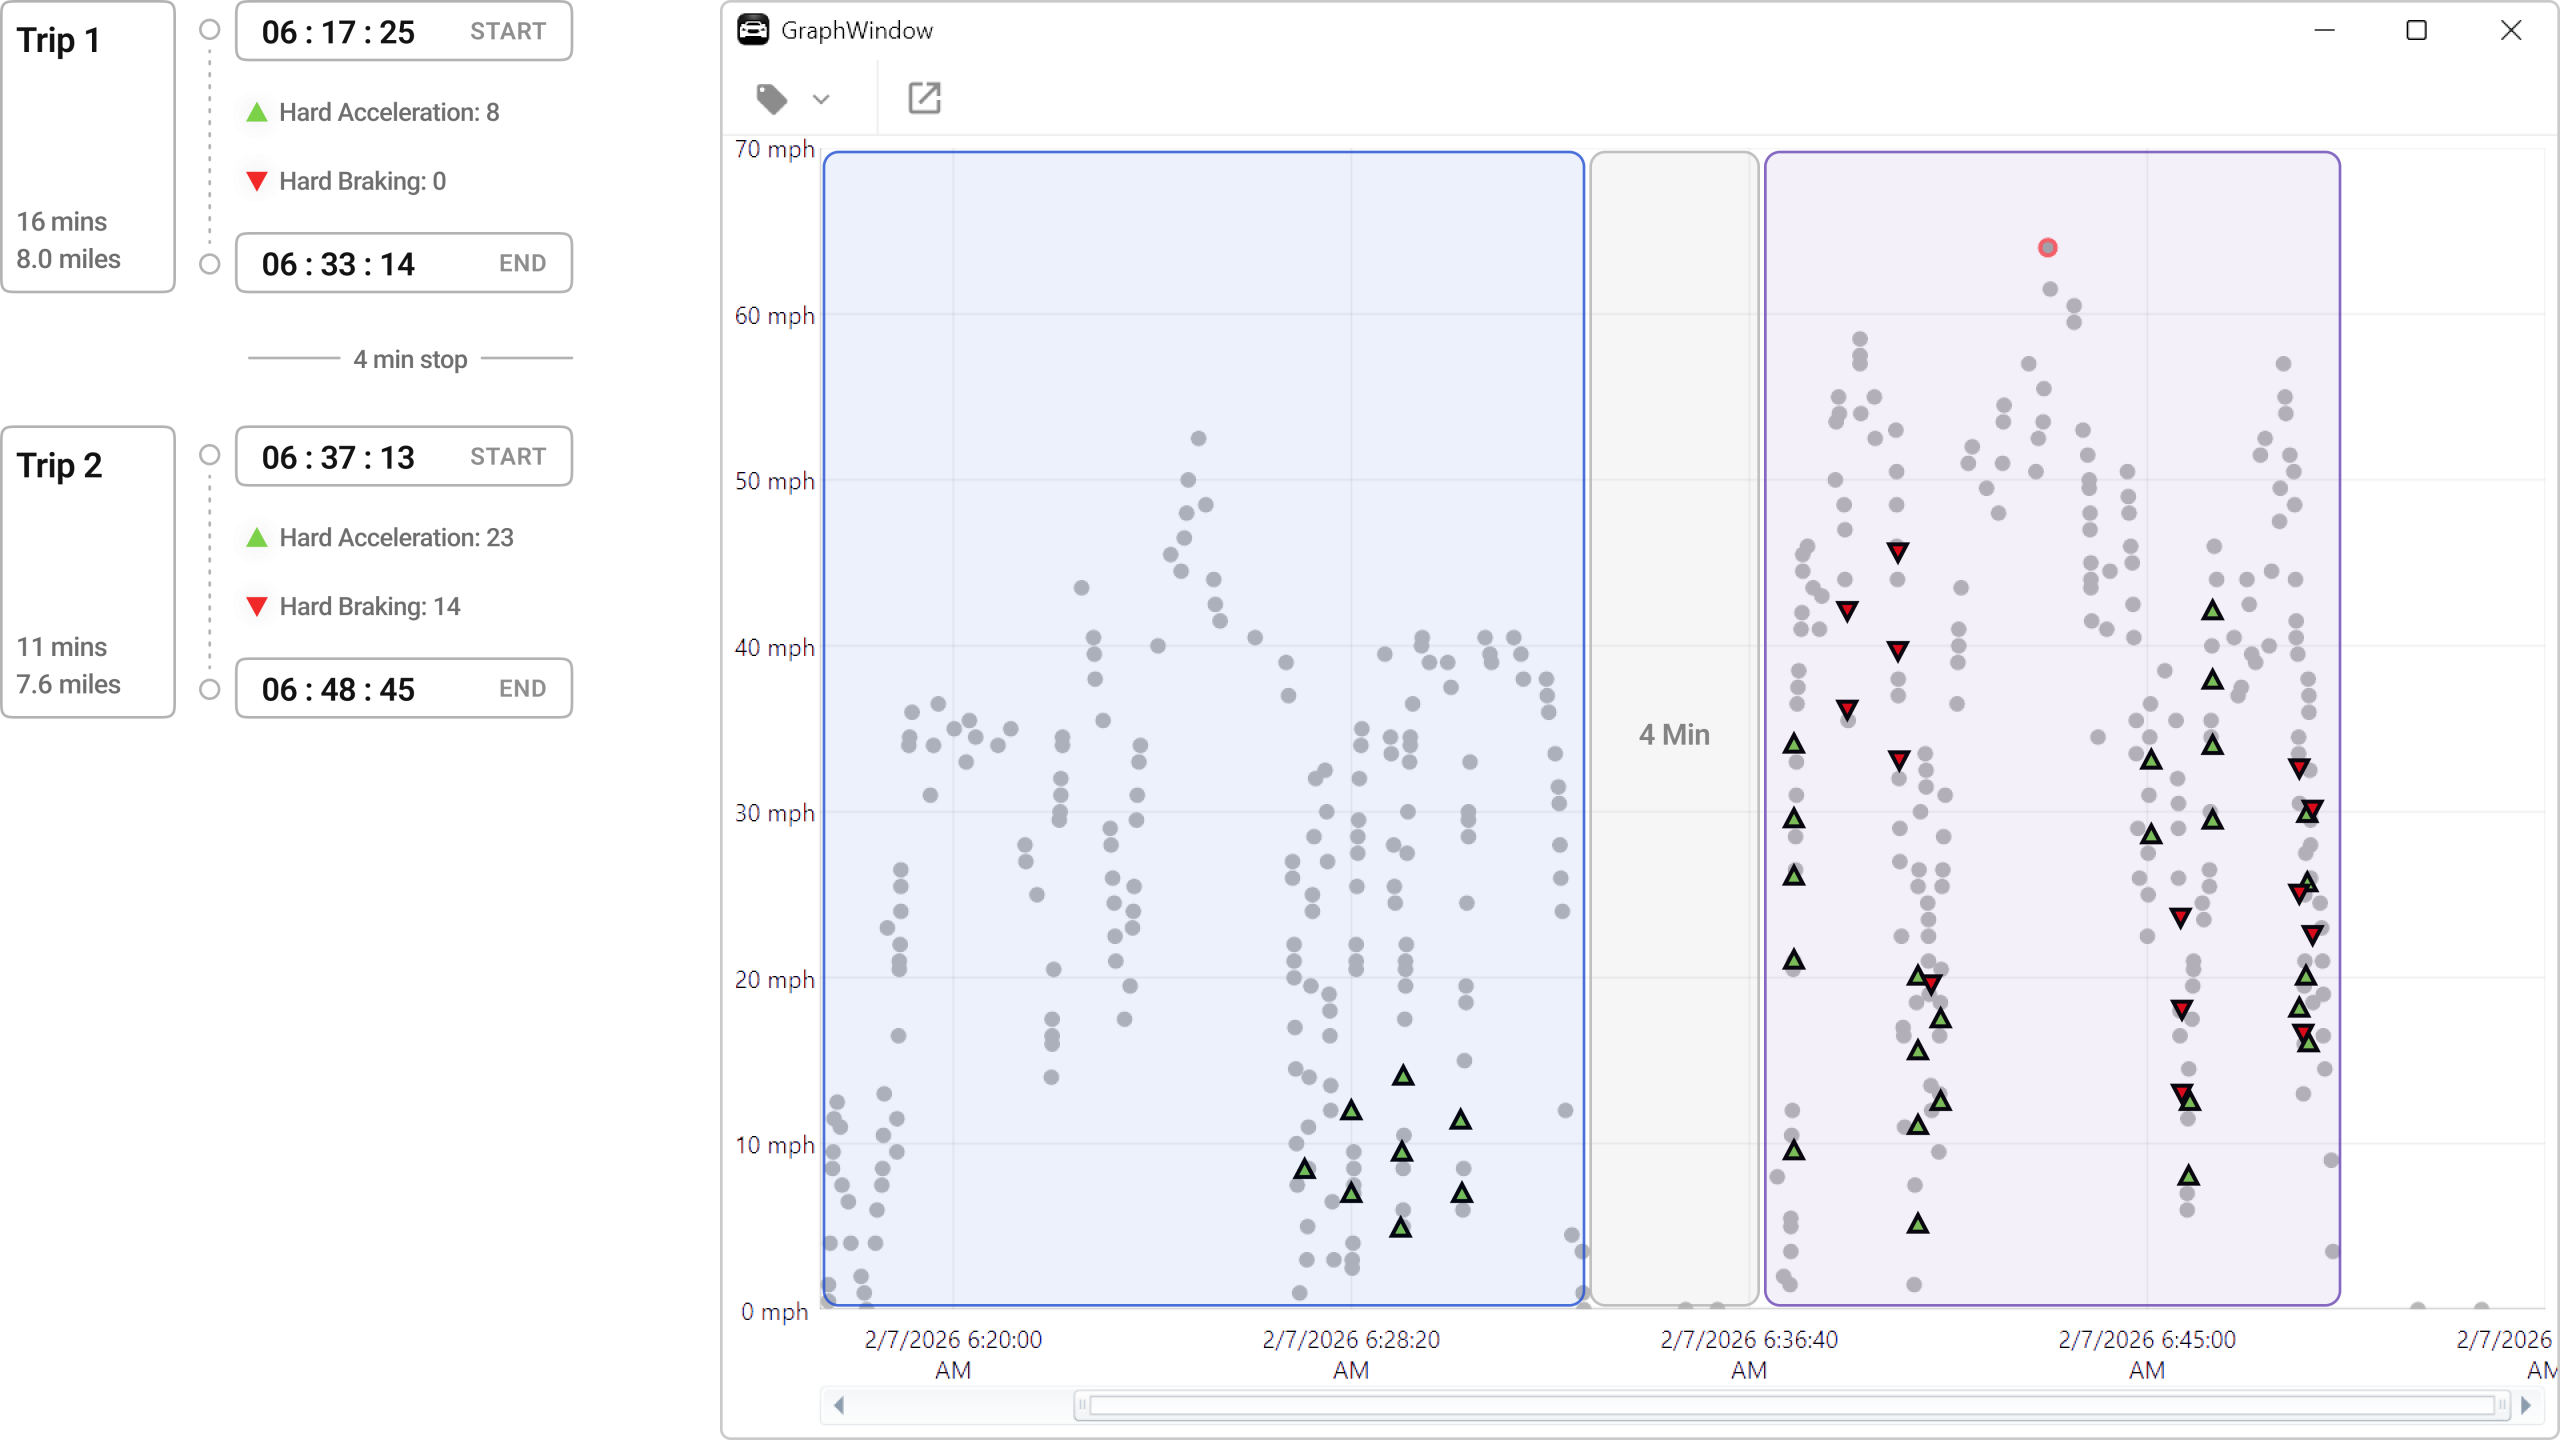
The side-by-side visual of duration, speed, and event density clearly demonstrates measurable differences in driving behavior. We will look carefully at each of these variables to conduct a more in-depth analysis of the differences between the two trips.
Duration Analysis
We start with trip durations, analyzing active driving times for each trip.
Trip 1 starts at 06:17 and arrives at 06:33 for a total duration of 16 minutes. The velocity logs then indicate a 4 minute stop. Trip 2 starts at 06:37, returning along the same route, indicating a total trip duration of 11 minutes. This shows us that Trip 2 is 4 minutes and 13 seconds faster than Trip 1.
Trip duration alone cannot conclusively identify aggressive driving patterns or excessive speeding, as the differences in duration could be due to any number of factors encountered along the route.
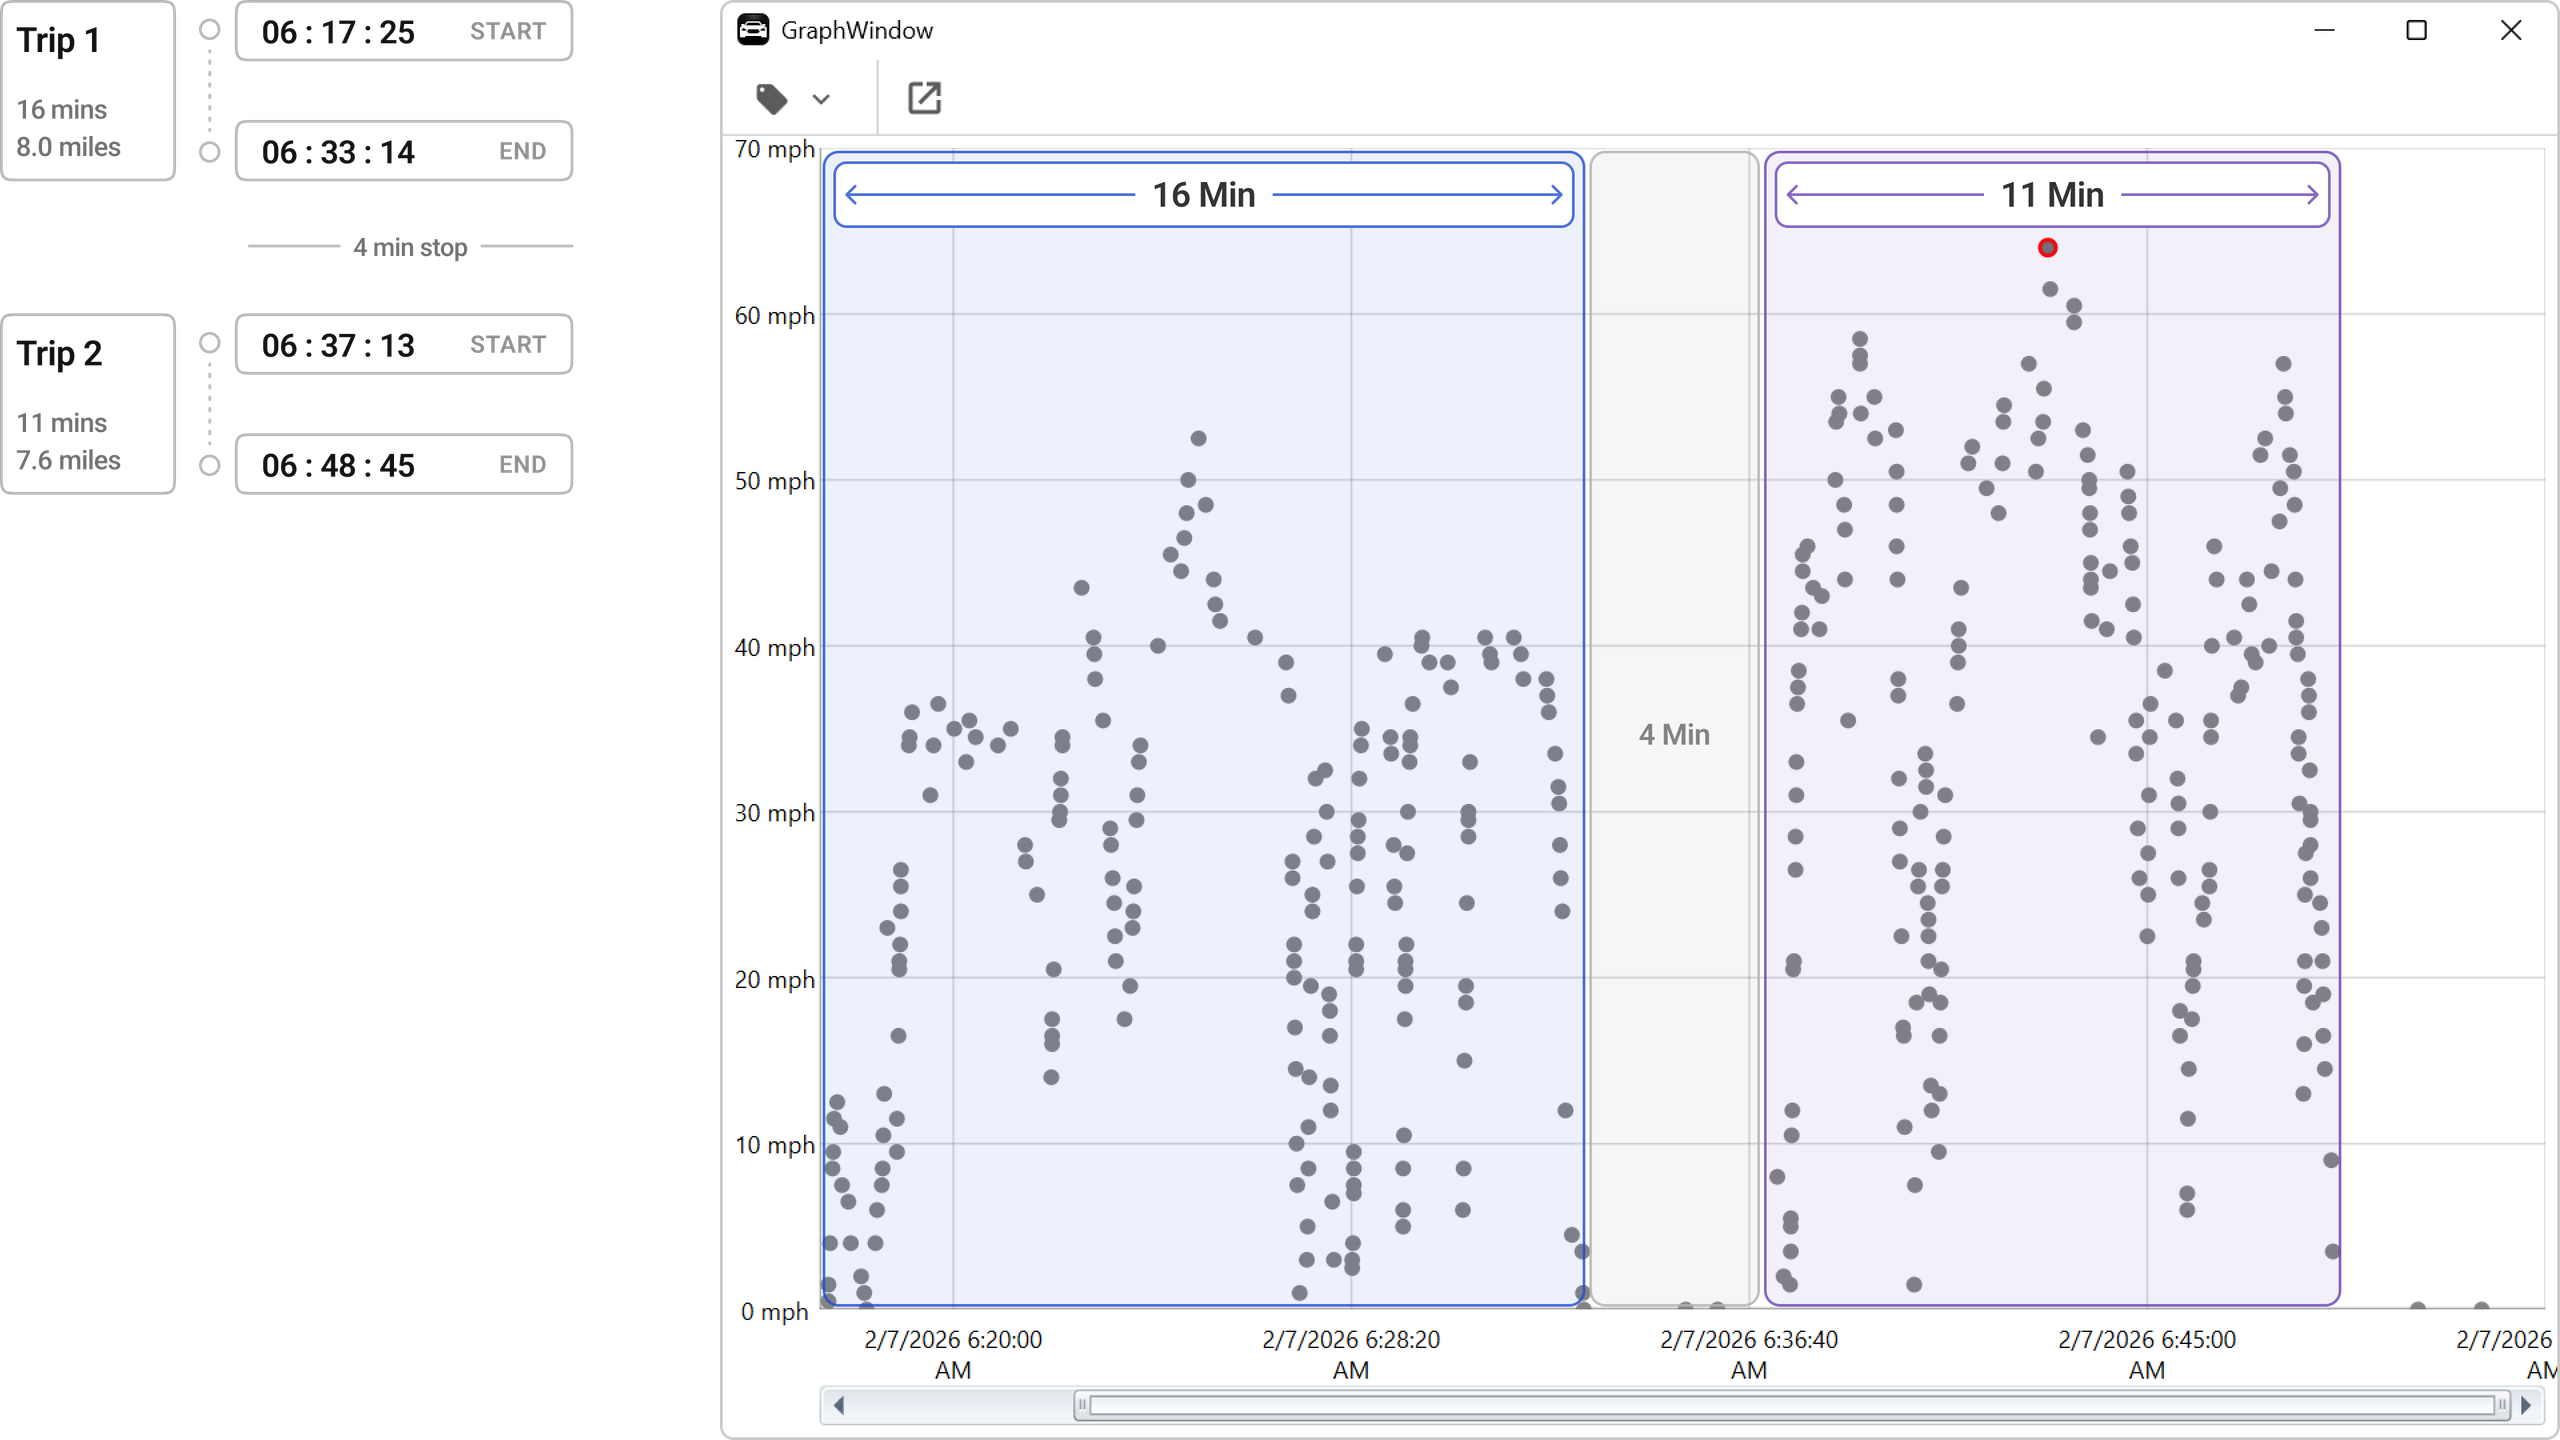
To better understand the differences in trip durations, we will examine the posted speed limits in comparison to the vehicle’s recorded speeds.
Speed Analysis
Posted speed limits for each roadway segment were captured as a baseline. The recorded vehicle speeds from iVe were then compared against the posted speed limits where each data point was captured. Comparing these two values allows us to determine compliance with posted speed limits and identify speeding or normal driving patterns.
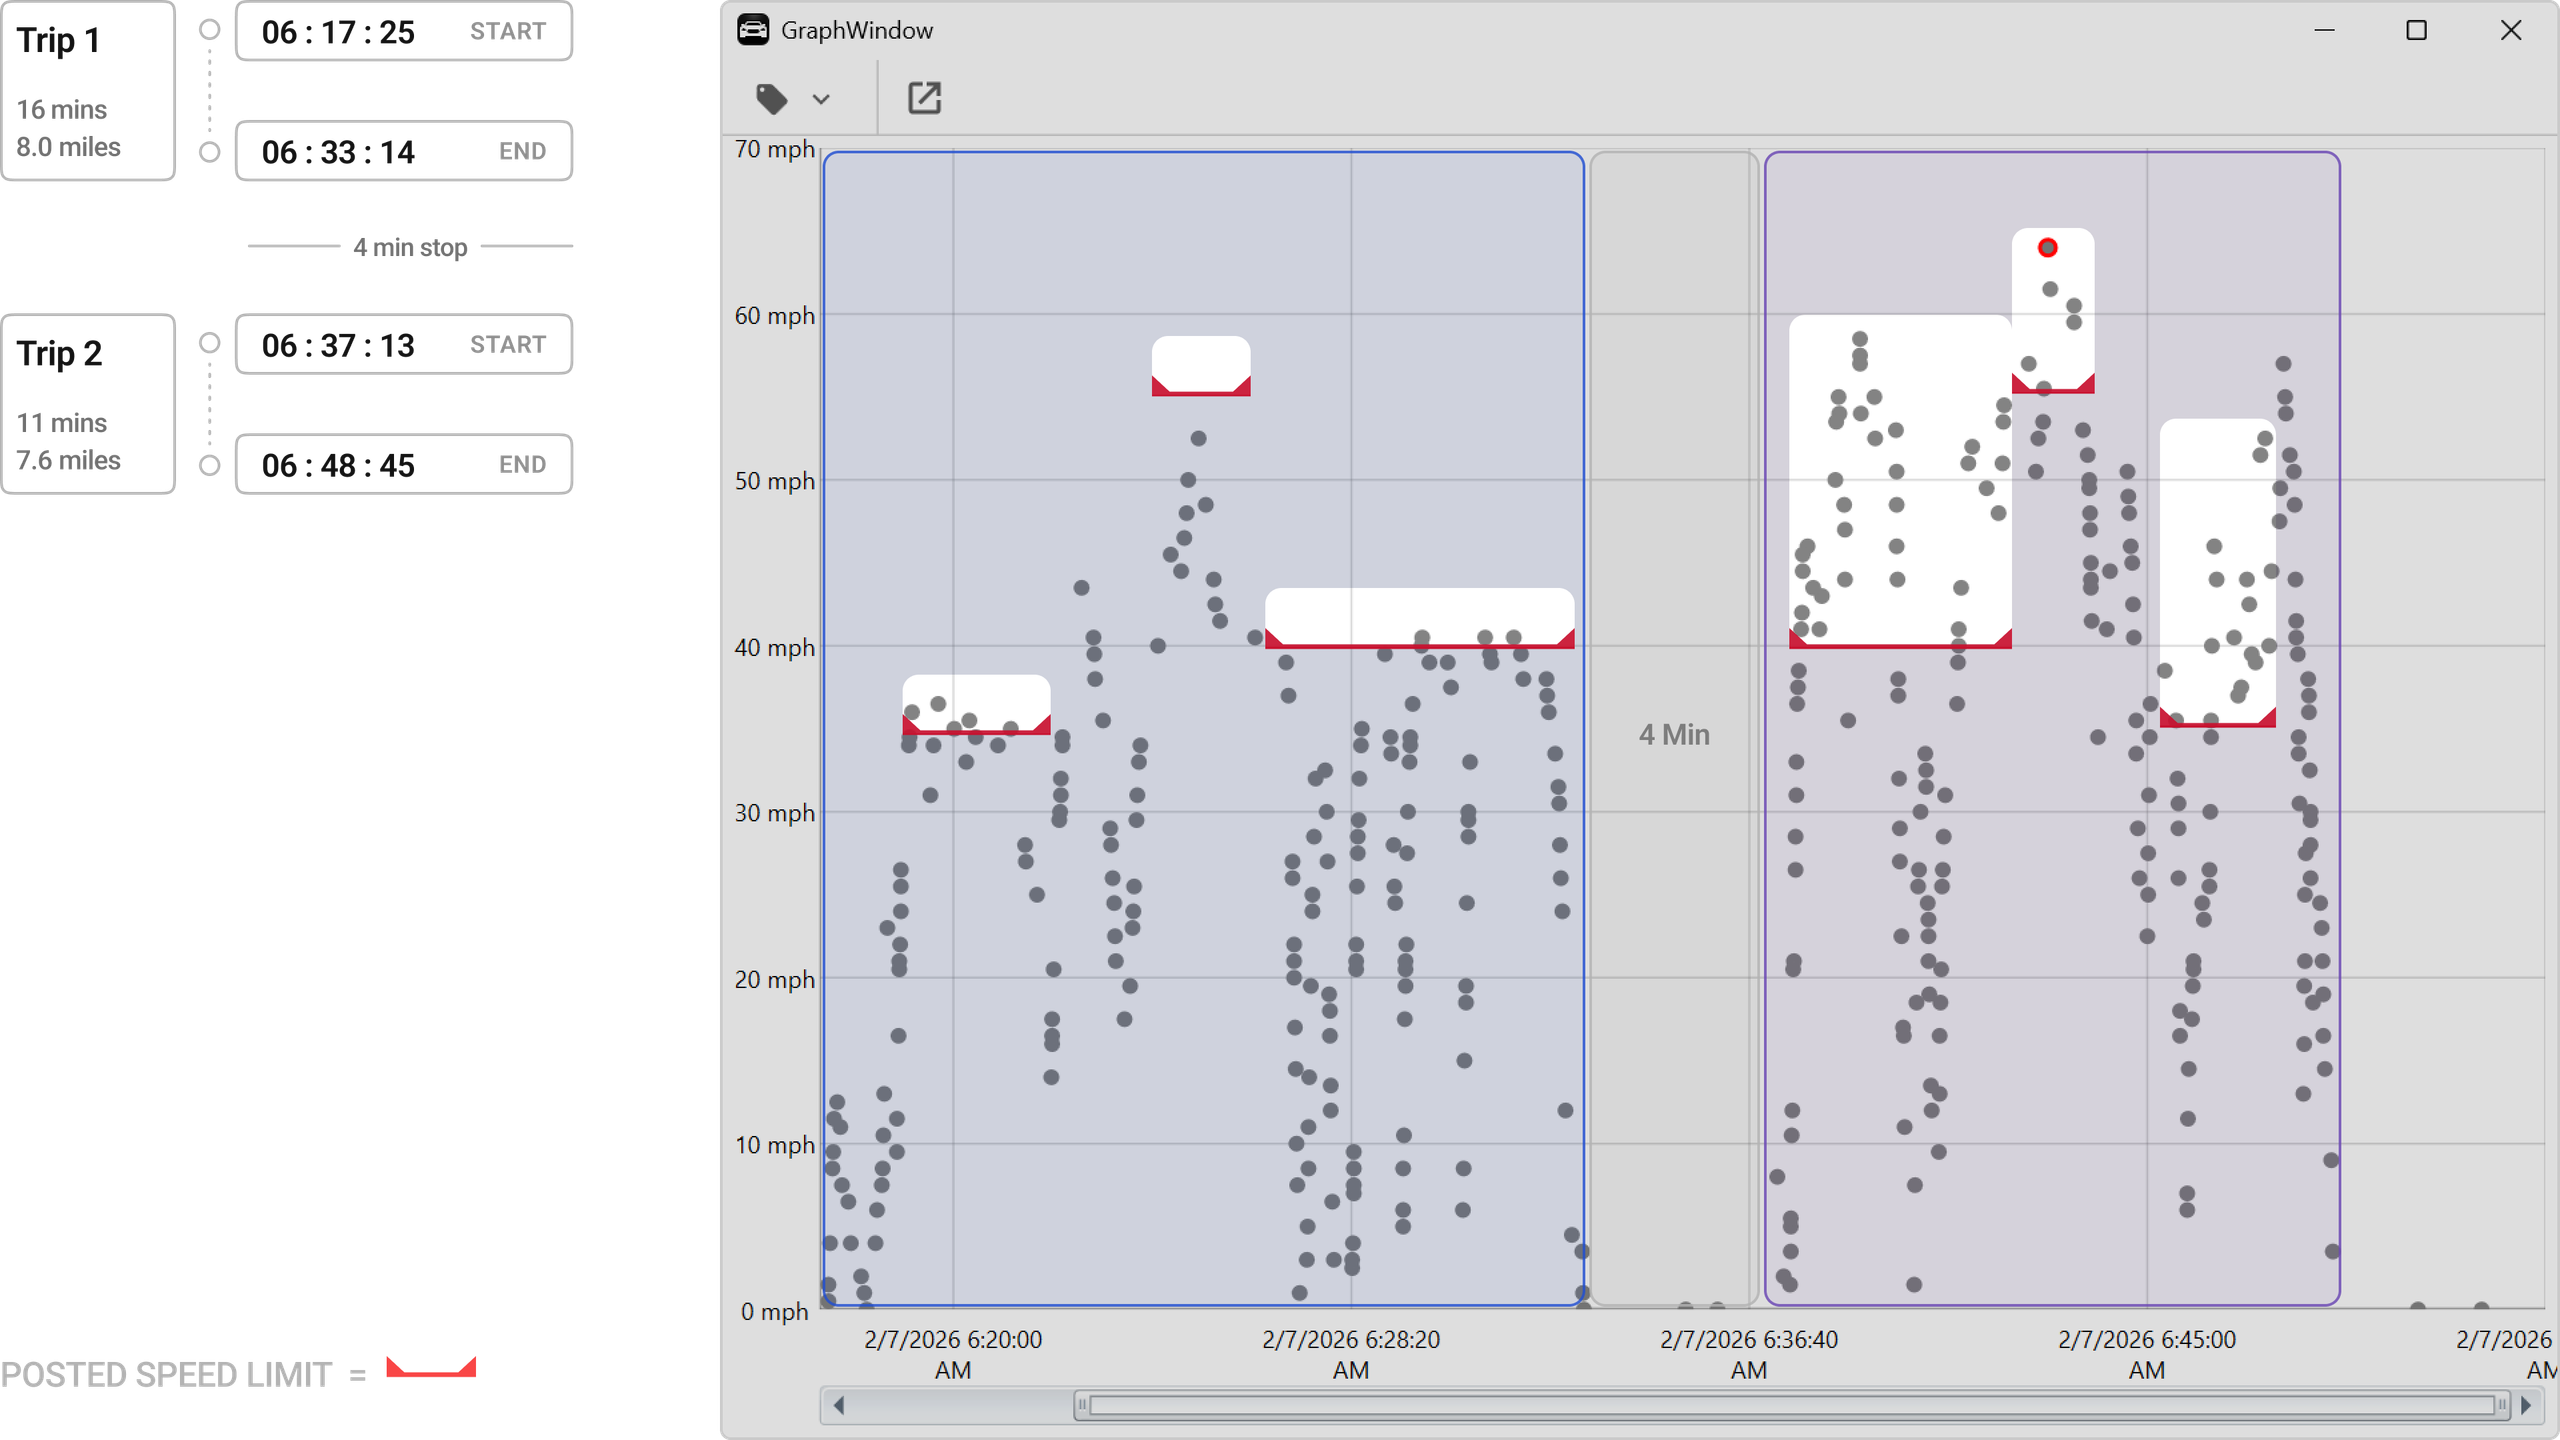
The data shows that Trip 1 remained largely within the posted speed limits throughout the trip. The recorded speeds never exceeded the applicable limit by more than 3 mph.
By contrast, Trip 2 recorded multiple instances where the posted speed limits were exceeded. On Forest Drive, the speed limit was exceeded by up to 19 mph. On Aris T. Allen Blvd, the highest recorded speed exceeded the limit by 9 mph. On Defense Highway, the speed limit was exceeded by up to 22 mph.
To further evaluate differences in driver behavior between the two trips, we will look at the frequency and concentration of hard acceleration and hard braking events.
Hard Acceleration & Hard Braking Events Analysis
Hard acceleration and hard braking events can provide unique insight into driver behavior. These events are logged when a sharp increase or decrease in speed occurs within a predetermined period of time.
A high concentration of these events can be informative from an investigative perspective, as they may suggest a notable change in driver mindset or can be indicative of reckless driving.
In iVe:
- Hard acceleration events are identified by a green upward triangle
- Hard braking events are identified by a red downward triangle
During Trip 1 we identified
- 8 Hard Acceleration Events
- 0 Hard Braking Events
During Trip 2 we identified:
- 23 Hard Acceleration Events
- 14 Hard Braking Events
Driving Patterns
Next we look for repeated driving patterns. This involves determining the duration of speed violations and the amount of accelerations beyond the posted speed limit. We can also document how often an acceleration began while the vehicle was already exceeding the speed limit.
To illustrate this more clearly, let’s focus on a specific segment of Trip 2 along Defense Highway, where the posted speed limit is 35 mph.
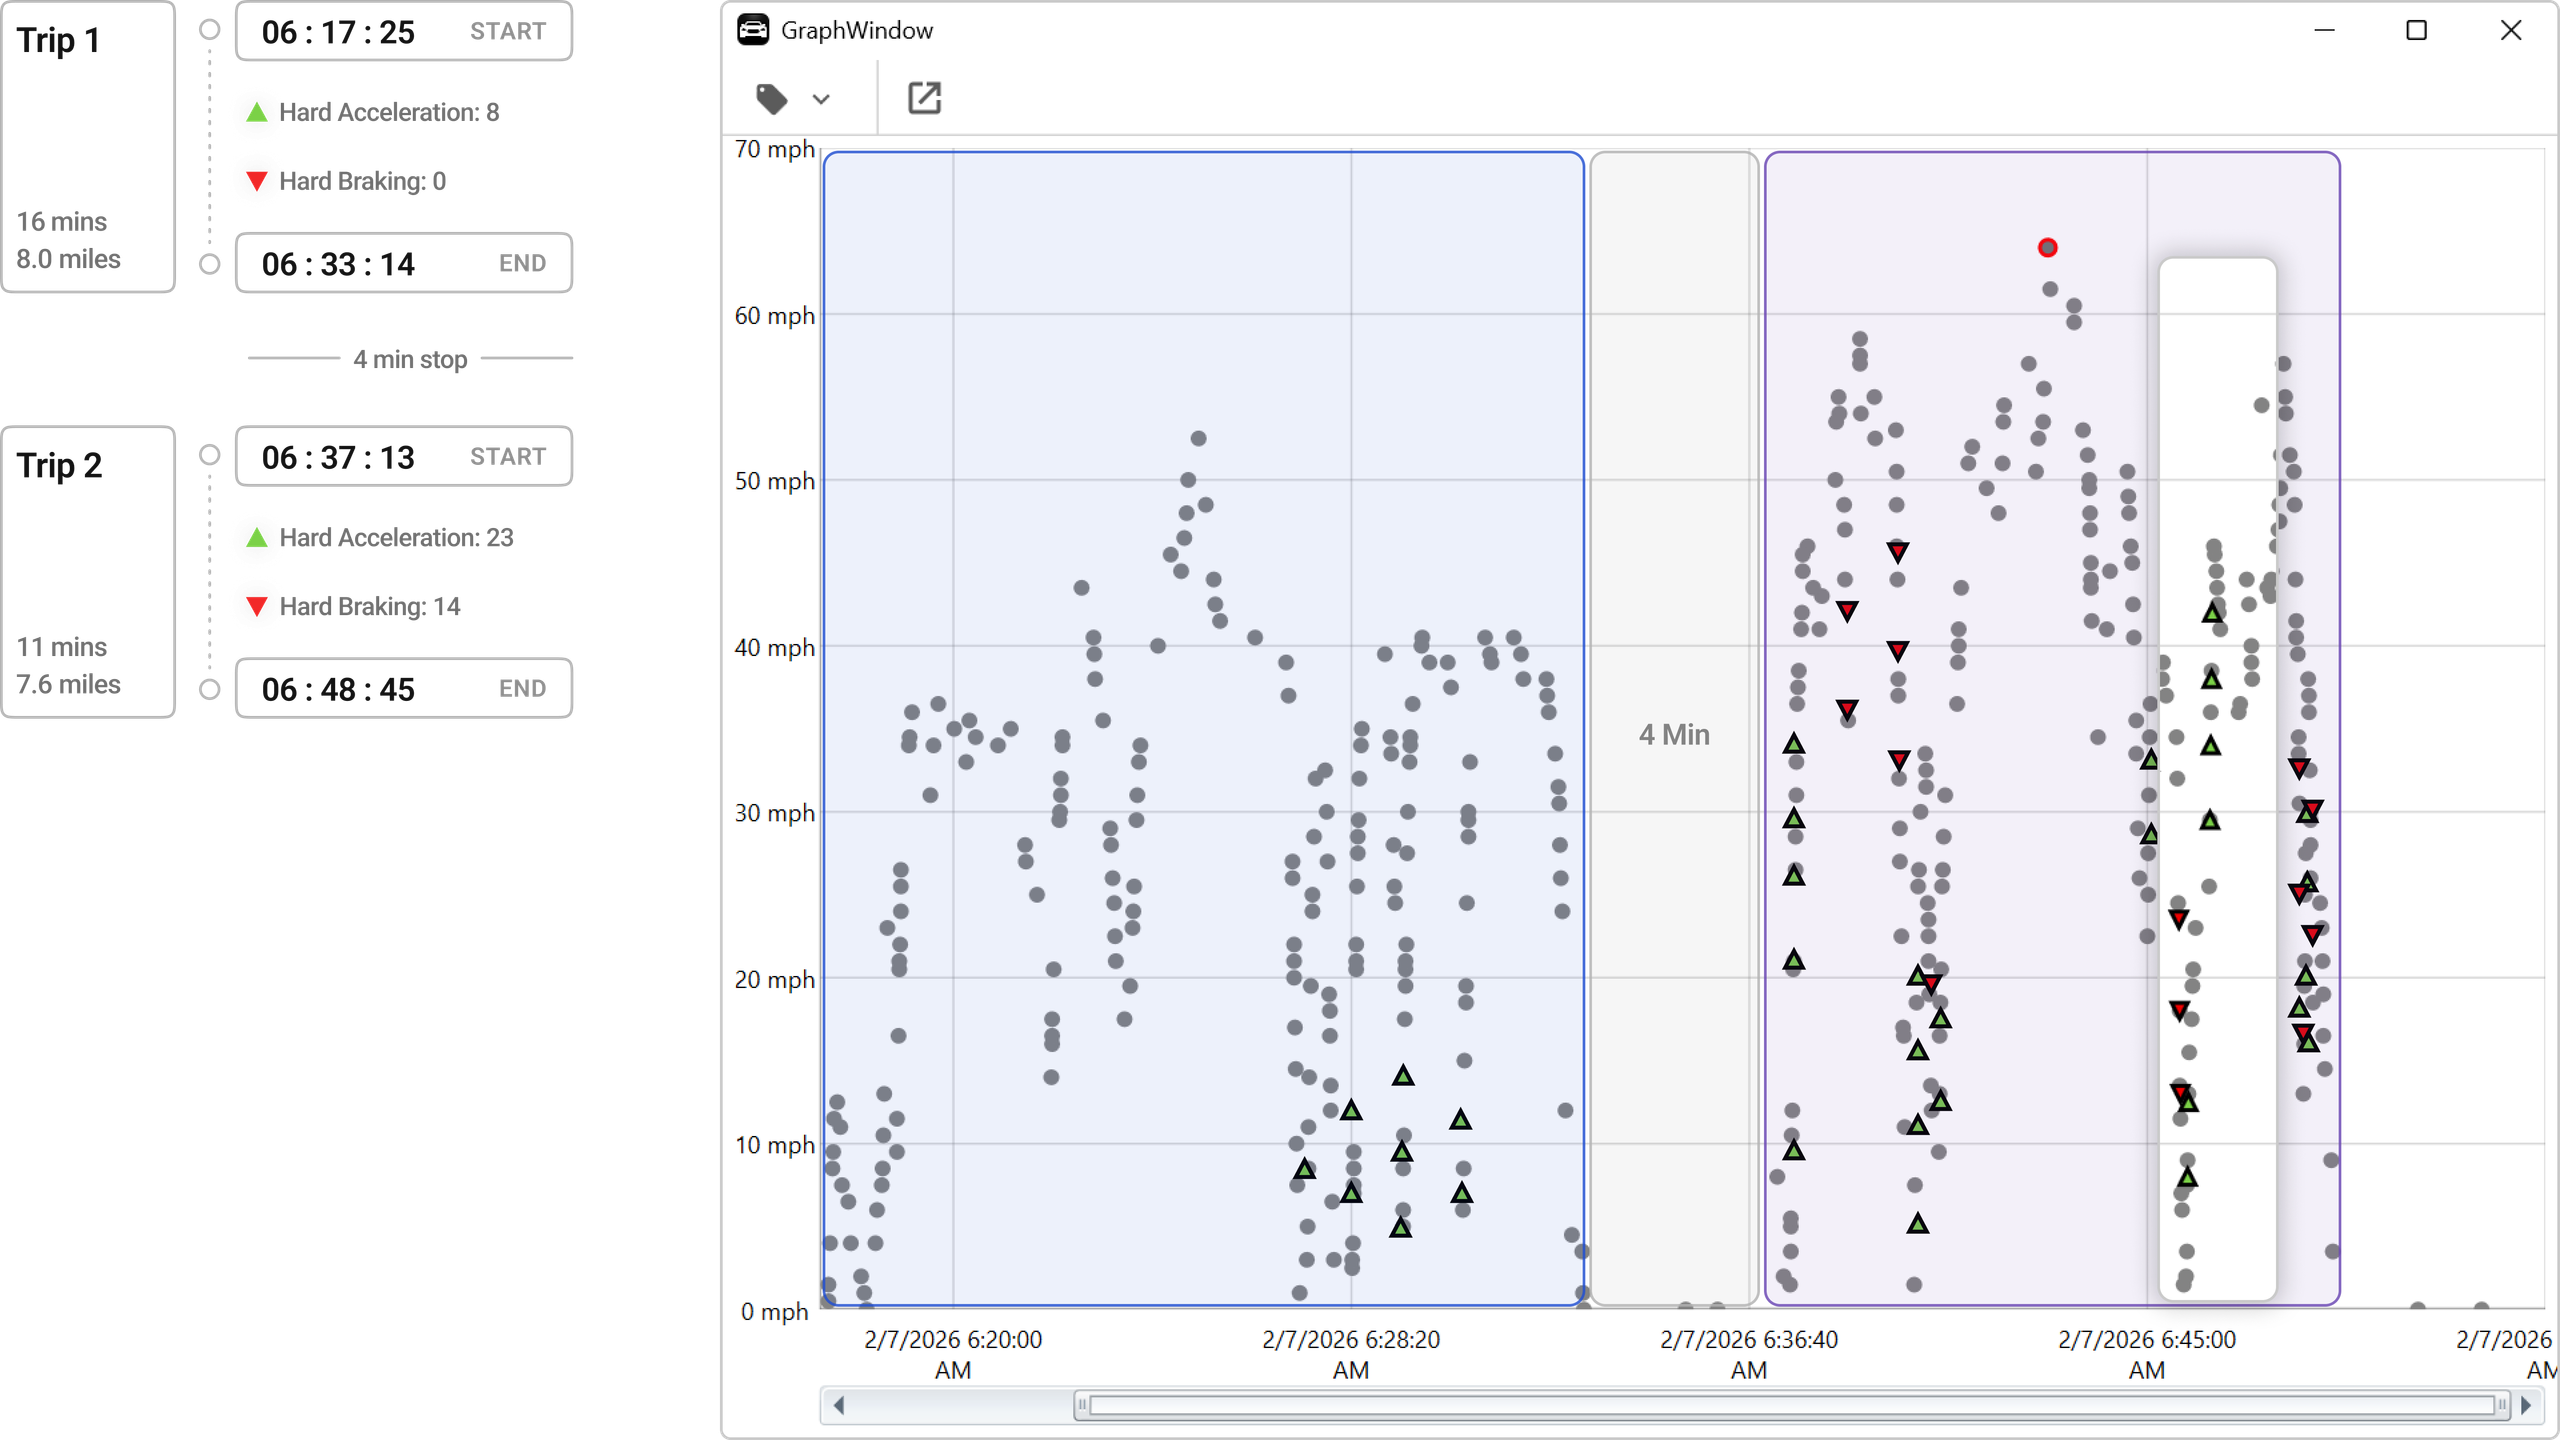
The first recorded speed exceeding the limit occurs at 6:45:12. From that point forward, speeds consistently peak between 10 – 20 mph over the limit for almost 3 minutes.
The driver was not only speeding — but in 6 instances, the driver continued to accelerate while already in excess of the speed limit.
In total, the vehicle traveled this segment for 3 minutes and 5 seconds, meaning the speeding occurred during almost the entire stretch, and the highest recorded speed was 22 mph over the limit.
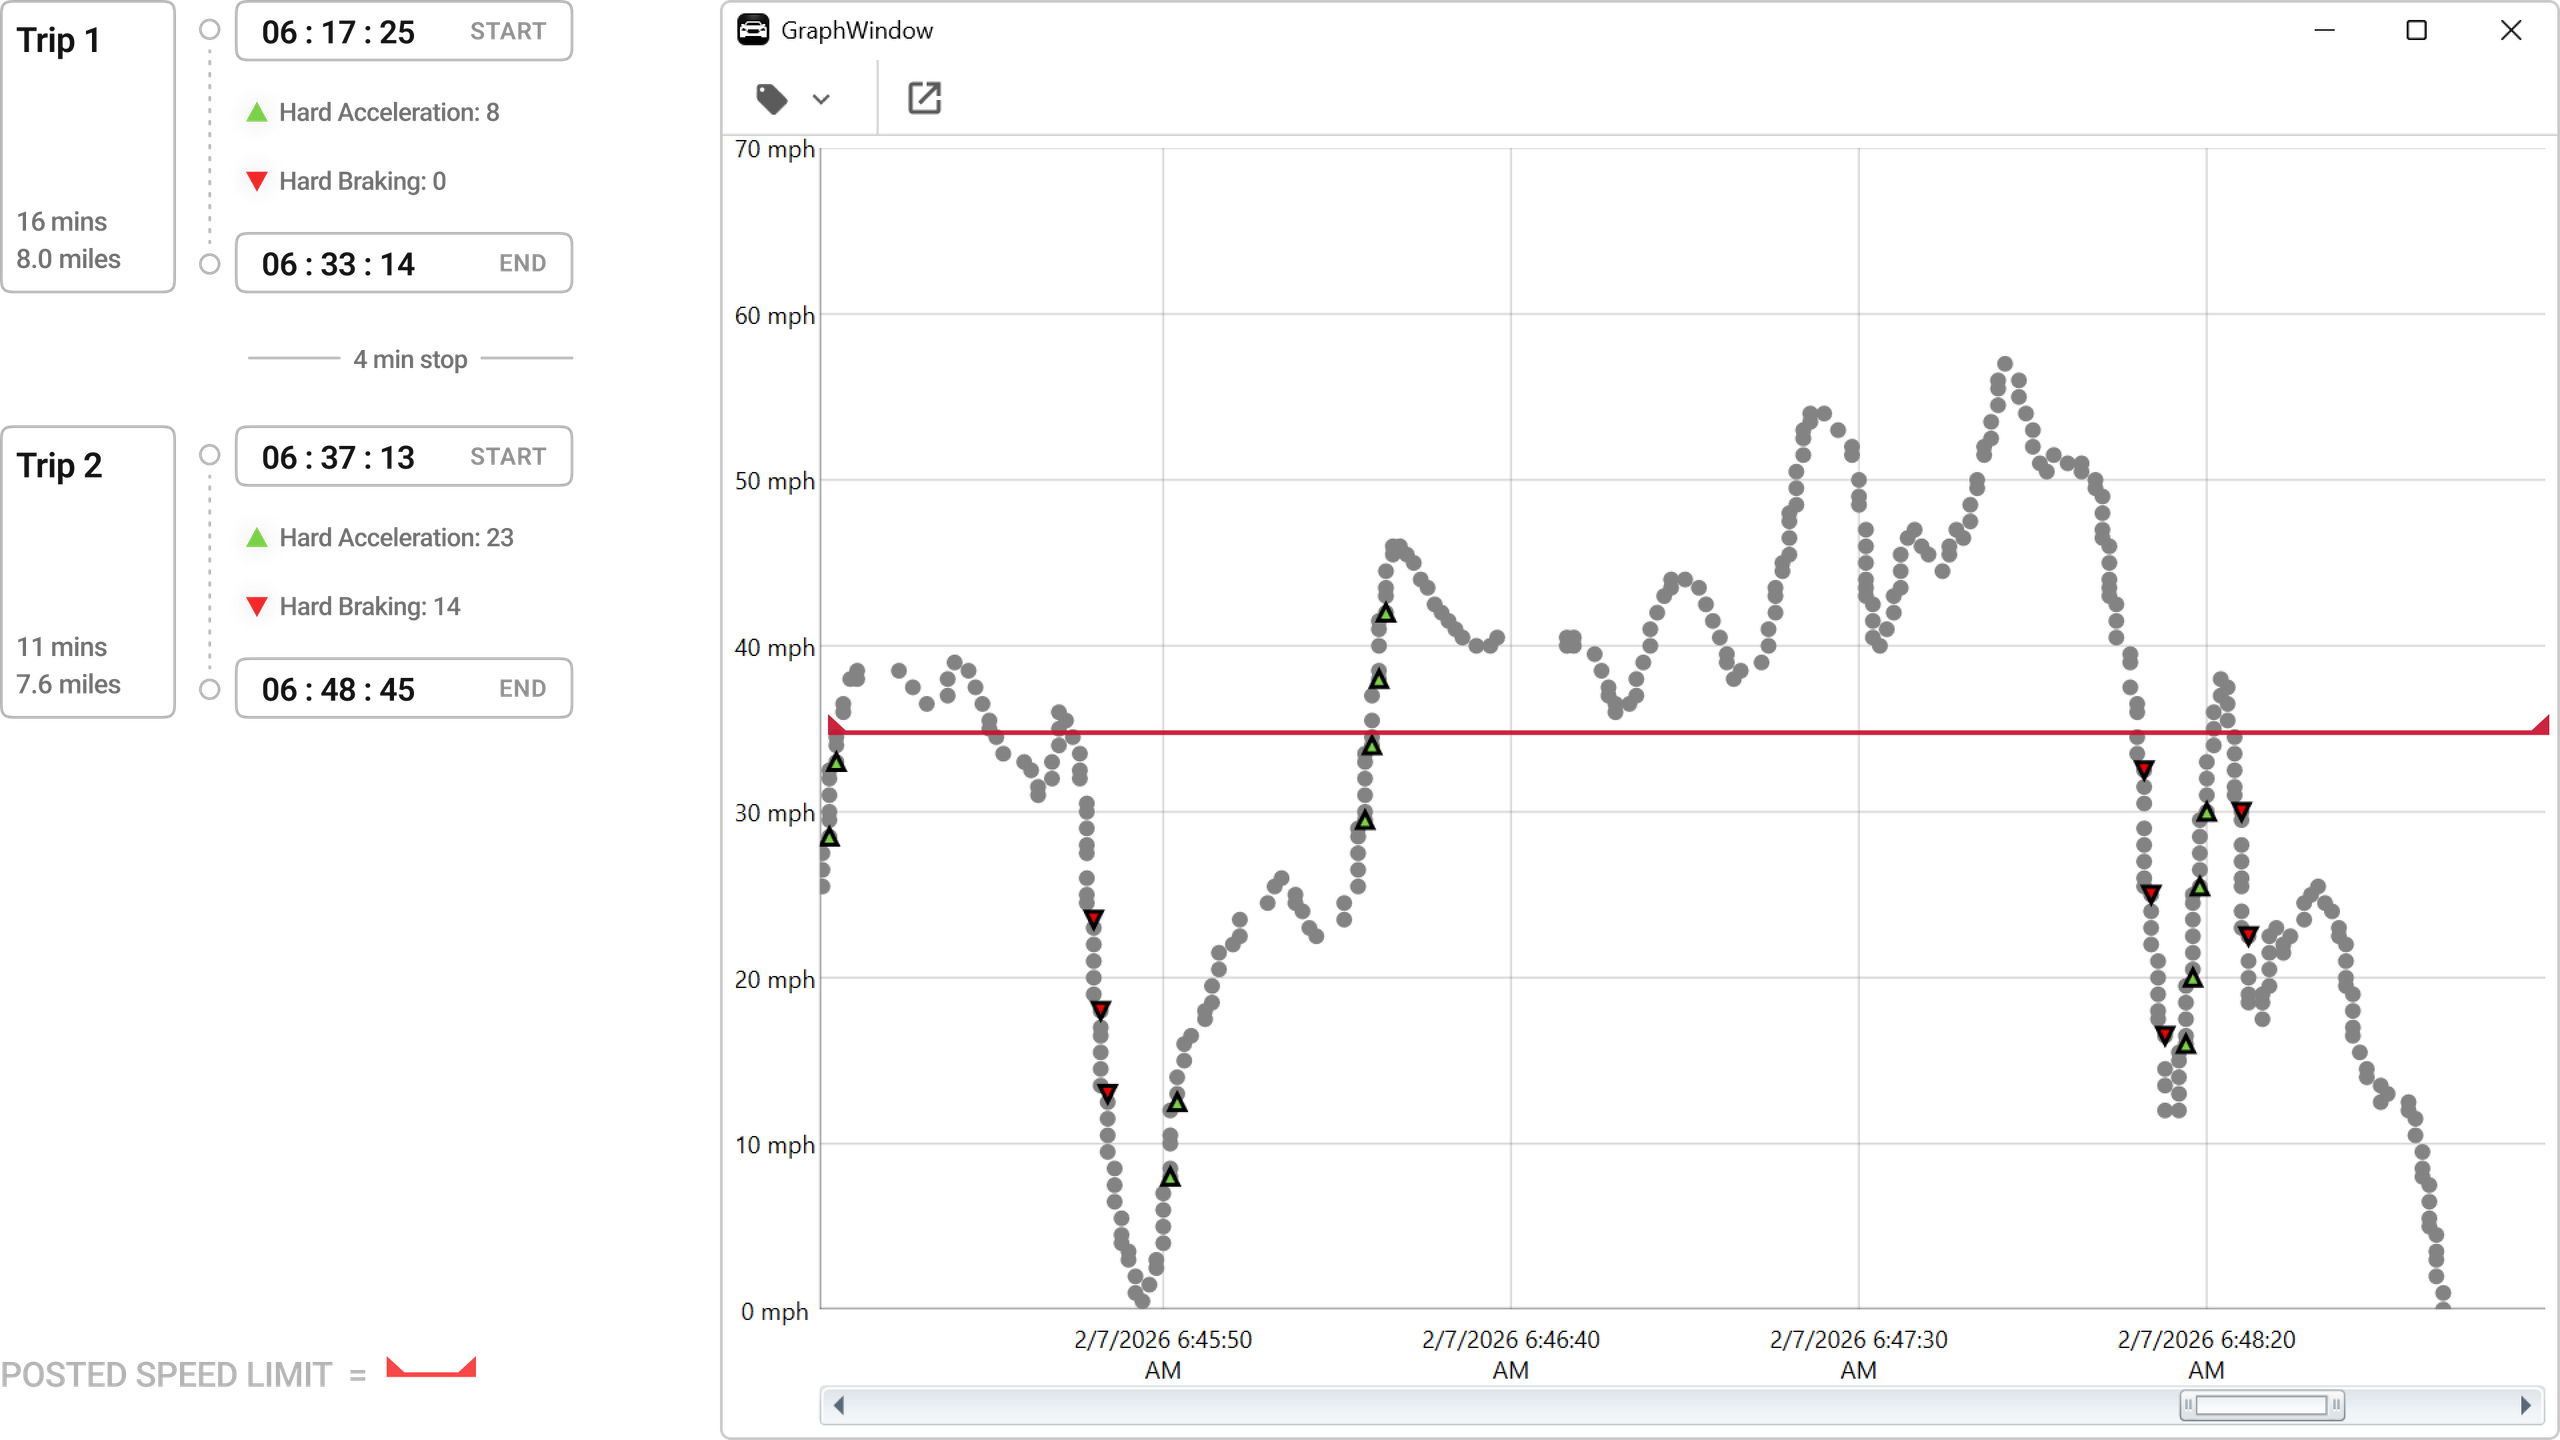
In comparison to the driving behavior in Trip 1 for this same stretch of road, the vehicle speed never exceeded any more than 3 mph over the speed limit.
Conclusion
In real-world investigations, it is critical to document and account for variables and conditions. While a single traffic violation may appear isolated, a pattern of repeated behavior, such as consistently exhibiting erratic driving or exceeding posted speed limits can provide valuable context. This type of analysis may corroborate witness statements, establish a history of similar driving patterns, or challenge an assumption.
The additional context can highlight distinct changes in driving behavior and help investigators determine whether the conduct represents an isolated incident or part of a broader pattern.