Hello, and welcome to our talk on Time Well-Spent: Precision Timing, Monotonic Clocks, and the PowerLogs Database for iOS.
As you might’ve guessed, we both work for Magnet Forensics, and this is the story of our research journey through PowerLogs on iOS.
First though, a little bit about us. I’m Mike Williamson, Forensic Consultant with Magnet Forensics. I joined up in 2019. I currently work for the RevOps team under the R&D section. I am former law enforcement, the last six years of which I spent in digital forensics.
And I’m Sab Strong. I am currently a software test specialist here at Magnet Forensics, and I joined in 2017. I’m a tester in the Artifacts Department, and I’ve been a software tester for just over 10 years.
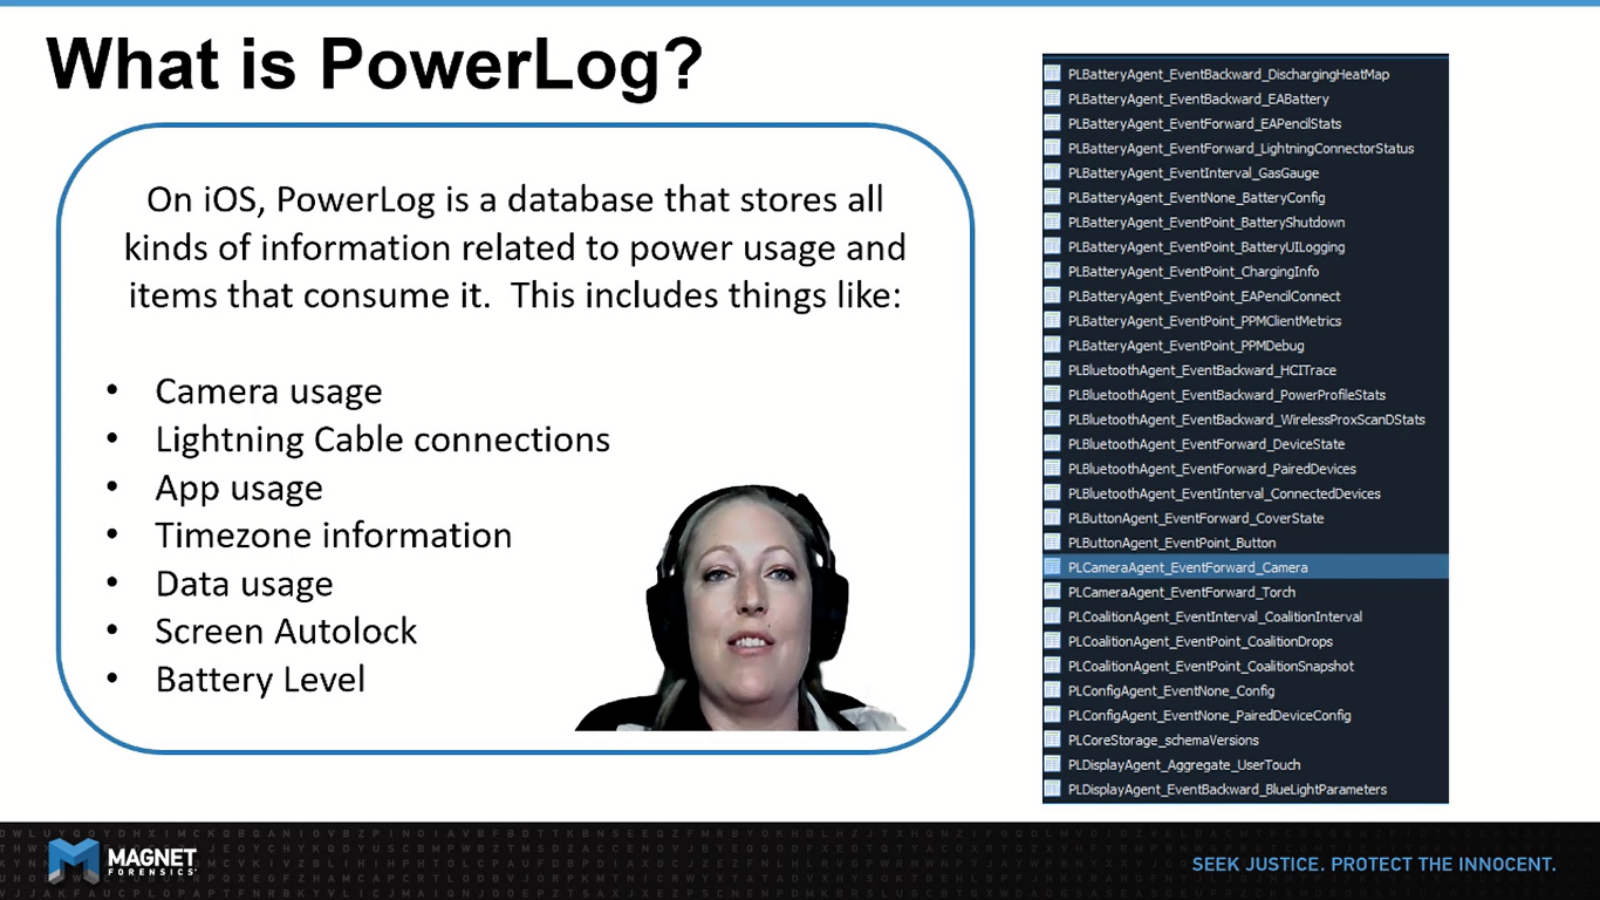
So you may be asking yourself, what is PowerLog? PowerLog is a database that stores all kinds of information related to power usage and items that consume it. This includes things like the camera usage, lightning cable connections, app usage, time zone information, data usage, screen logs, battery levels, and a plethora of other things.

Hey Mike, so I’ve been looking over the iOS PowerLog artifact, and I noticed that the date and time is a calculated value for some artifacts, but not for all. This seems really weird. I think we should look into this and figure out what the correct value is.
Hey, Sab, that is odd. I agree we should definitely look into this. This is also a perfect candidate to use some of my famous reverse engineering techniques.
So for our first approach, since there is no application for PowerLog, we initially cast a big net using FRIDA and reviewed any processes that were running that contained the word ‘power’.
The result was that there was a lot of data with false positives, as numerous processes did have the word ‘power’. Sometimes you get lucky with this approach, but in this case, there were just too many.
So for our second approach, we decided to programmatically iterate over all the running processes on the device and review their loaded modules and alert if the module included the word ‘PowerLog’.
But this was also inconclusive. As it turns out a large number of apps referenced the Powerlog.framework, which actually makes a lot of sense, once we learned the Powerlog entries are handled using XPC or a Cross Process Communication.
For a third approach, we decided to monitor the file system using fsmon, and this is where we discovered the PowerLogHelperD, and aggregateD processes, which looked really promising.
As you can see here, Fsmon has captured writes to the entire folder. So the CurrentPowerlog.PLSQL entries are more towards the bottom, highlighted here, and within those entries there are two processes, the ones Sab mentioned earlier in particular.

And the big problem here is that it doesn’t include the -wal file as well. However, while we were doing this test, we did notice that the PowerLogHelperD seemed to shut down immediately after use. So because of that, we decided to start with the aggregateD.
After reviewing the loaded modules at the aggregateD process, we found that numerous PowerLog related frameworks are imported. As you can see here, the full paths are listed. However, when we visited these paths via SSH to obtain them for static analysis, they were not present.
We eventually discovered the binaries for PrivateFrameworks, such as PowerLog.framework, and all of its friends are actually stored together in one giant file known as dyld_shared_cache_arm64. Now, if you’ve ever done iOS extractions, you have probably seen this file, as one of the larger files on an extraction coming in at around two gigabytes in size.
So using a Python script called DyldExtractor, we were able to extract binaries for private frameworks of interest, and perform static analysis using Hopper disassembler. Unlike in our process scan, searching with the word ‘power’ here seemed quite effective.
Limneos.net is an excellent resource for iOS runtime headers. Here, we can easily review what classes, properties and methods exist in a given PrivateFramework.
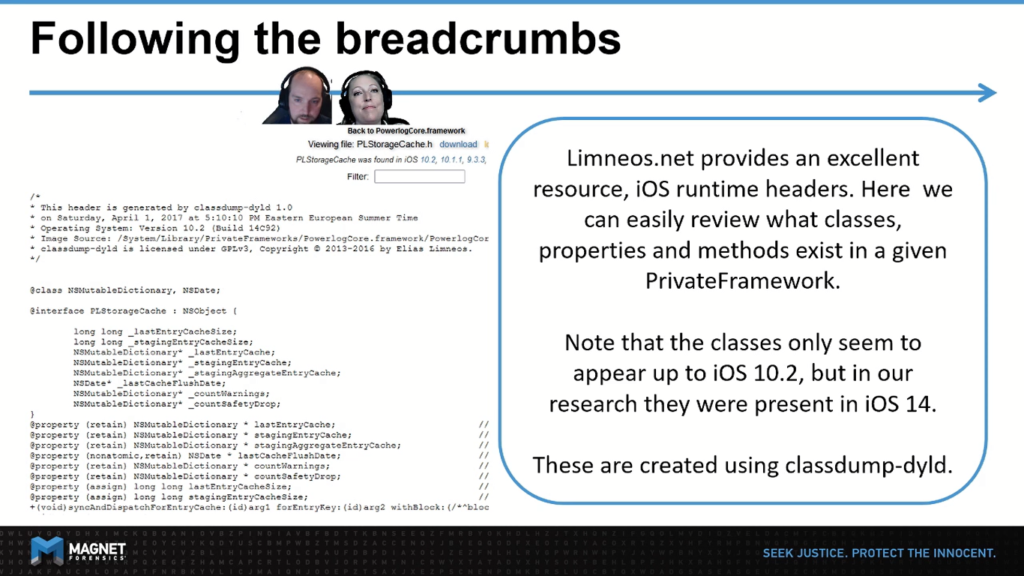
So you may notice that the classes indicated here only go up to iOS 10.2. In our research, however, we did find them all the way up to iOS 14. We can actually generate these headers ourselves using the classdump-dyld or review them in a static analysis tool like Hopper.
Well, looking through PowerLogCore.Framework, this is where we first came across the word monotonic. As you can see with the function calls below, we started to feel like we were onto something.
Seeing all these conversions wasn’t particularly surprising given that our current standard of interpretation requires applying a system offset to the timestamp stored in the database. But the word monotonic wasn’t one that we were completely familiar with. And so we felt like based on our static analysis here, it was going to be a critical part of understanding this end to end.
So like us, you may be asking yourself, what is monotonic time? Well, after looking into this, monotonic time is a source that won’t ever jump forward or backward due to daylight savings, time updates. It will only ever tick forwards.
So for example, let’s say you are programmatically recording how long a function takes, and this is during daylight savings time. If you were using the display time, your total time of the function run will actually be affected by the daylight savings time change either positively or negatively.
So you can see the obvious bearing on forensics here especially considering things like user manipulation, et cetera. So it really answers the question of why, why they would use this in PowerLog, and the main reason is that PowerLog records as stored will always end up being in the correct order. But that time will not be exactly as per, without needing to compute an offset.
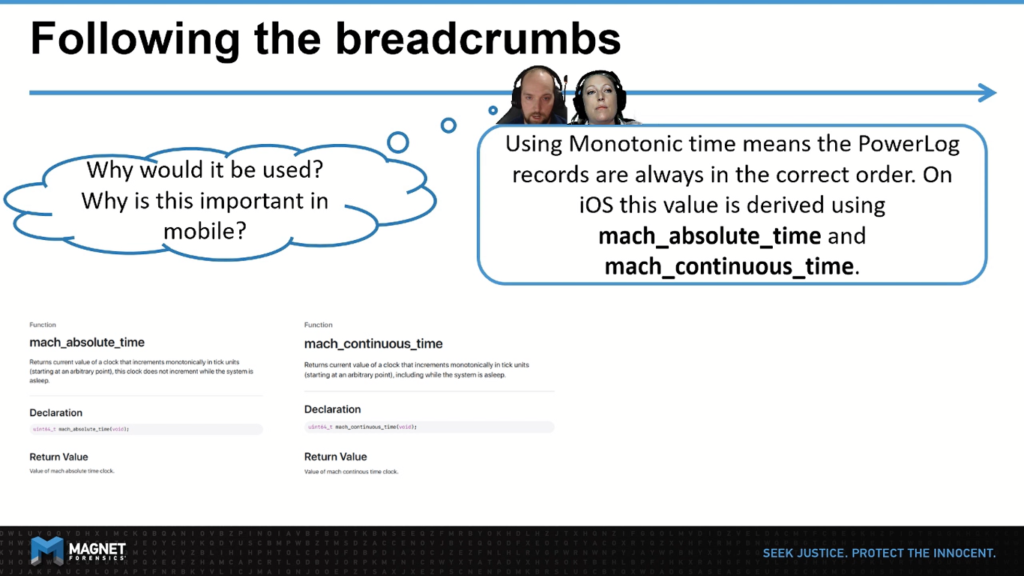
So in order to compute monotonic time on iOS, there are two clocks available to us, mach_absolute_time and mach_continuous_time. These are both monotonic clocks, but things do get a little bit more complicated on iOS. As you can see, the processor goes to sleep, mach_absolute_time actually pauses. Whereas the mach_continuous_time does not.
The last thing to add on this is that the mach_absolute and mach_continuous times return the number of ticks elapsed since the last device reboot. So you actually have to do some additional math in order to convert those ticks into seconds, and then to transform it into a relative date.
You may have noticed on the previous slide, there were functions that included the word Baseband, and looking further into this and what that actually meant, we’ve discovered that it refers to the standalone chip set on the device that manages all of the Cellular Network functions, i.e the modem and cellular data. iOS uses this to have another time reference that is unmanipulated by the user. However, not all devices have Baseband chips, which is why it can not be the only source of truth, but it’s stored for reference.
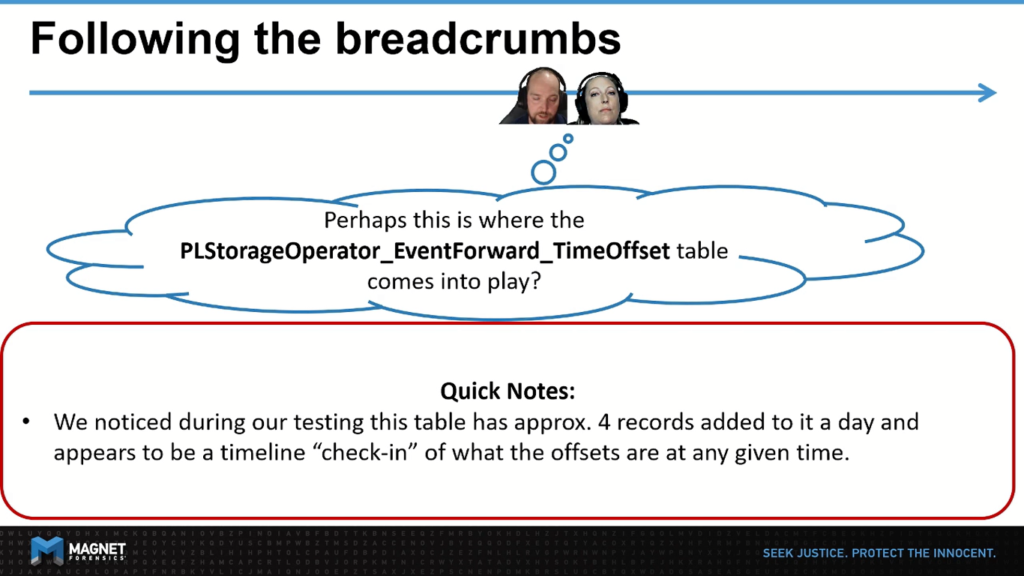
This is where we started wondering that perhaps the PLStorageOperator_EventForward_TimeOffset table, that is in the CurrentPowerLog database must come into play.
So we did notice during our testing that this table gets populated about four times a day with very minor changes to the offsets. Almost like a timing check-in of what those offsets are at any given time. Another way that rows get added to this table is when you change the device time manually, and in a future slide here, we actually cover off on how that exactly looks.
Putting all this new knowledge together, we’re now able to start tracing PowerLog events at runtime, using FRIDA. For this test, we found that Camera Events, PLCameraAgent, as the trigger for tracing, was easy to use because all we needed to do was manipulate the camera from within any app, such as turning the camera on and off or switching from front to back cameras, we can trigger a ‘handleCameraEvent’ call and then review its parameters with FRIDA.
Some quick notes, before we delve into this. We did notice that events are written to the database in batches at set intervals either every 15 minutes or whenever the queue is full. This made testing a little bit tricky. That is until we found the flushCachesWithReason command that actually forces a database write, so that we could validate our results.
And I absolutely loved this use of arbitrary method indication as a way of really cutting down on the tedium of having to wait for the entries to be entered into the database.
The other thing was that because most of our events are coming across using Cross Process Communication, that means that aggregateD is essentially responsible for receiving these messages, queuing them up, and then eventually writing them to the database.
For our research, we really wanted to capture those interactions in FRIDA, and then afterward retrieve the CurrentPowerLog database in order to verify our findings.
So on this slide, you can see a few things. In the top right, you can see a Frida trace from our camera event. In the bottom right, you can see a script that we’ve put together that includes all the math to help us prove our theories. And on the left hand side, you can see a snippet of the PLCameraAgent_EventForward_Camera and PLStorageOperator_EventForward_ TimeOffset tables that are within the CurrentPowerLog.PLSQL database.
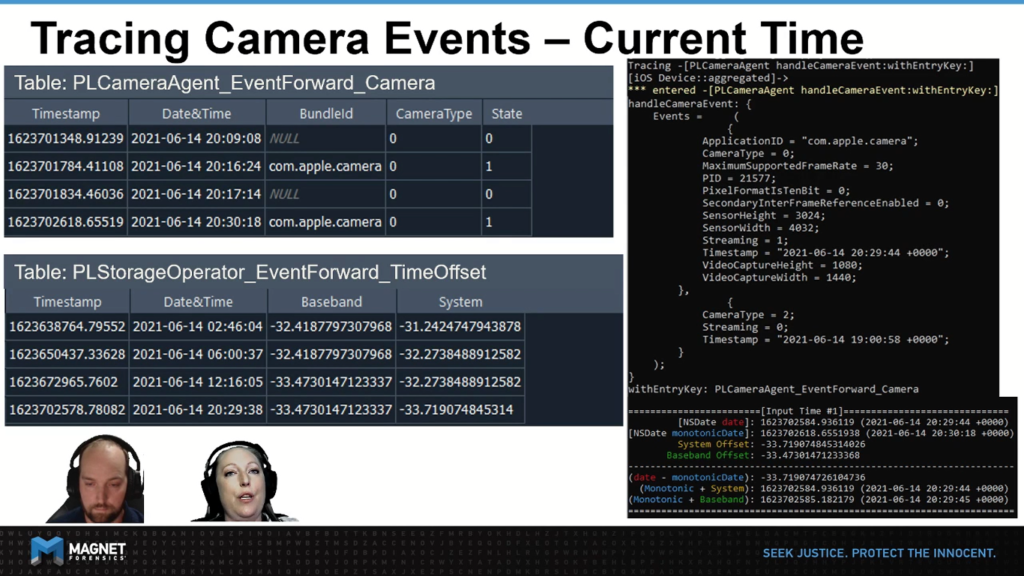
For readability, we’ve provided both the Unit timestamps and the human readable date times. In this example, we’ve set the device to be synchronized using the automatic time setting.
So here we can see the first event pass to handle camera events in our FRIDA trace comes with a Timestamp, which is highlighted in red at the top. This is the equivalent to calling NSDate date in objective C and is marked down in our computation section at the bottom.
In our method hook, we’re using FRIDA to call NSDate MonotonicDate, which is again based on the mach_continuous_time. Notice that it appears as the associated timestamp inside that camera table.
In the computation area, you can also see how we pull up the current time offsets for both system and Baseband, and you can see that they aligned to the time offset table on the left. One thing to remember here about the time offset table is that it represents a timeline of the devices’ differences between clocks.
This means that when you are looking at a timestamp that occurred in the past, you need to match it up with the record that happened before your timestamp to ensure you were applying the correct offset within that timeframe. You will also want to play to pay close attention to how similar the Baseband and system offsets are in this example.
There’s one last thing that I wanted to mention as an important caveat. And that is to remember that with these big long numbers, with all these decimals, we’re dealing with fractions of a second. We found that sometimes in our experiments that we were not exactly getting the same answer and that there was 0.02 or 0.002 of a difference, for example.
So we realized that with high precision timing like this, even though we’re working inside of aggregateD with Frida, it’s not possible for us to resolve multiple timestamps at the same instant, so there will always be a slight margin of error.
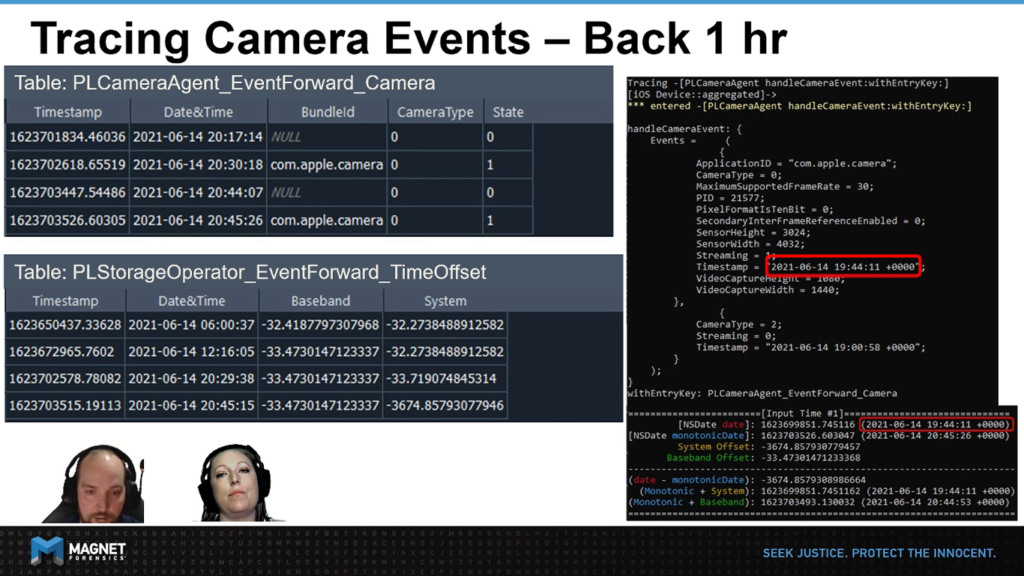
We have a very similar setup here from our previous slide. The key difference is that in this example, we’ve disabled the automatic time syncing, and rolled the time back by approximately one hour. So let’s go through our computations again and try to spot what changes have taken place.
On our first step, we can see that the handle camera event hook is receiving a time that is about an hour back from what we saw in the previous slide. Our monotonic time, however, has not changed significantly. As you can see what ultimately lands in the database appears to be very much in sequence with the events that happened prior, and there’s no evidence of this display time change by the user.
If you took notes on our last slide of the offsets for both Baseband and system you’ll have noticed, they previously were almost exactly the same, but now with the user having updated the display time, the system offset has a significant difference by approximately 3,640 seconds.
Why not 3,600 exactly, you might ask? This is the difference between the user setting the clock back exactly to a specific moment with zero seconds and losing the extra seconds that would have been there prior to that change.
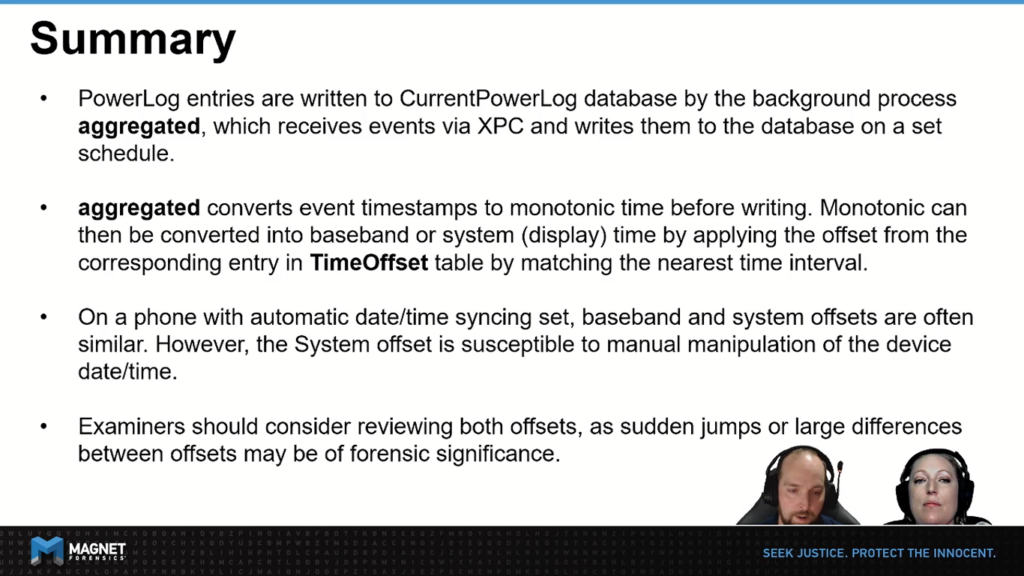
In summary, keep in mind, PowerLog entries are written to the CurrentPowerLog database by the background process, aggregateD, which collects events from XPC and writes them into the database on a set schedule. There is something I also wanted to mention here. The CurrentPowerLog database only holds approximately seven days worth of data, and for any further history, you do have to check the backup .gzip files.
The other thing to remember is that aggregateD converts event timestamps that it’s received into monotonic time before writing them to the database. Remember that monotonic time is this clock that is always progressing forward. From the database, we can then convert them into Baseband or system display time by applying the correct offset from the corresponding entry in our time offsets table, by matching the nearest interval.
When encountering a device that has been set to automatic date-time syncing baseband and system offsets are often similar. However, if the user has been manipulating the time, you will notice it is the system offset that reflects this. During our proof of concept validation, we looked at several different devices, data sources, and we discovered a few data sets where the time offsets were very high and far apart, with timestamps that didn’t even look real. However, once we did the calculations and applied the offsets, the date and times did in fact line up correctly.
So as forensic examiners, when we’re dealing with PowerLog data, I would recommend that if that PowerLog data is going to be evidentiary in nature, that it’s important to review both the baseband and system offsets. Given that the sudden jumps, or large differences between them, can be of forensic significance.
Thank you for taking some time out of your busy schedule to join us. We hope this information is timely for you, and should you have any questions please don’t hesitate to take the time to reach out to us. Have a wonderful day.