Justin: Alright. So, hello. And this is a recorded video, so just kind of, welcome, whenever you’re watching this. I’m Justin Tolman, I am the Director of Training for AccessData, and today, for the next little bit, we’ll be talking about Windows event logs, and specifically the login information associated with Windows event logs and how we can timeline those and kind of get a chronology for those.
So we’re going to use a bunch of different things here to take a look at that information. We’ll have a little bit of slides, not much, because we’re going to just get in and look at the different stuff, we don’t have to rely on slides.
So. Alright. So first off, when we’re running an investigation, or a matter, whatever we’re going to call it, we’re typically looking at the activities of people and their behaviours, so we want to establish what happened, when it happened, what were they doing, did they do anything? And so one place we can see a lot of that, that naturally logs a lot of that information chronologically is the Windows event logs. And so we can see application activity, hardware activity, but what we’re going to talk about specifically here is the log on log off in the boot and shutdown records that are stored in these logs.

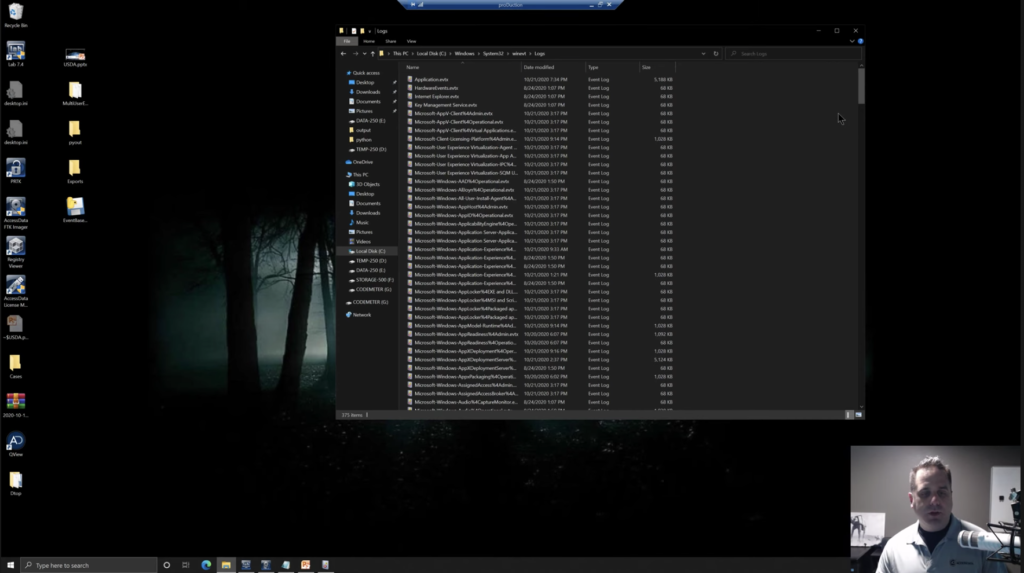
So first off, the Windows event logs are stored on the C drive of the Windows operating system, OK? So Windows, system 32, Winevent or WinEVT logs. And within this directory are going to be a bunch of different logs. And you can actually see them when it’s booted up, that’s why we have this little image here, if we exit out of the slide deck real quick, we can open up Explorer, go to the C drive, Windows, system 32, way down here at the bottom, and then we can scan down — there’s a lot of stuff in here — and then we can see the Windows event, and then logs in here. And we’ll look at these logs here in a second. Well, not all of them. But, you know, the relevant ones, in a second.
But you can get those… so even if you’re not using forensic tools, or that sort of stuff, if you’re just going through it yourself, and we’ll look at how we can do that as forensically as possible even without tools, we can take a look at it. So a little spoiler there on the slides.
So again, we’re going to take a look at that, and those logs are held in the security.evtx event logs. There’s various logs, as you saw in that directory, there’s a bunch of them. We’re going to focus on security.evtx. Within there, specifically, we’re going to narrow even further down, we’re going to look at some of the log on, log off, boot, shutdown event IDs.
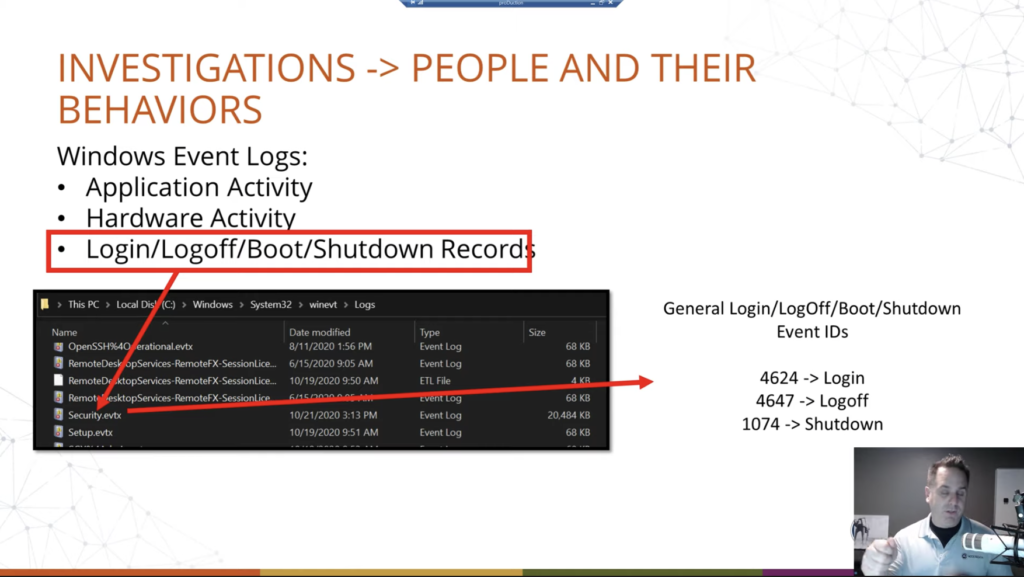
Now, the various events within the event log are broken down by IDs, and this is not just for log on, log off, this is for everything. Plug in a USB drive, there’s an event for that. Unplug it, there’s an event for that. So on and so forth, all through the thing. So we’re going to look at these three specifically, we’re going to kind of focus in on that, but there are other event IDs that are associated with log on. These are the big ones, though. These are the login, successful log offs, shut downs, restarts, those sorts of things. Okay. And so for the sake of time and presenting, we’re going to focus on these three.
So event ID 4624 is your logins, and we’ll talk about the different types of logins that can happen in Windows. 4647 is your log off. And then 1074 is your restarts or your shutdowns. Now with the log offs, that’s a general log off, again, so there are other types, depending on if they’re with remote desktop, those types of things. Again, we’re just going to kind of narrow it down to these general ones. Okay. The event logs can get deep.
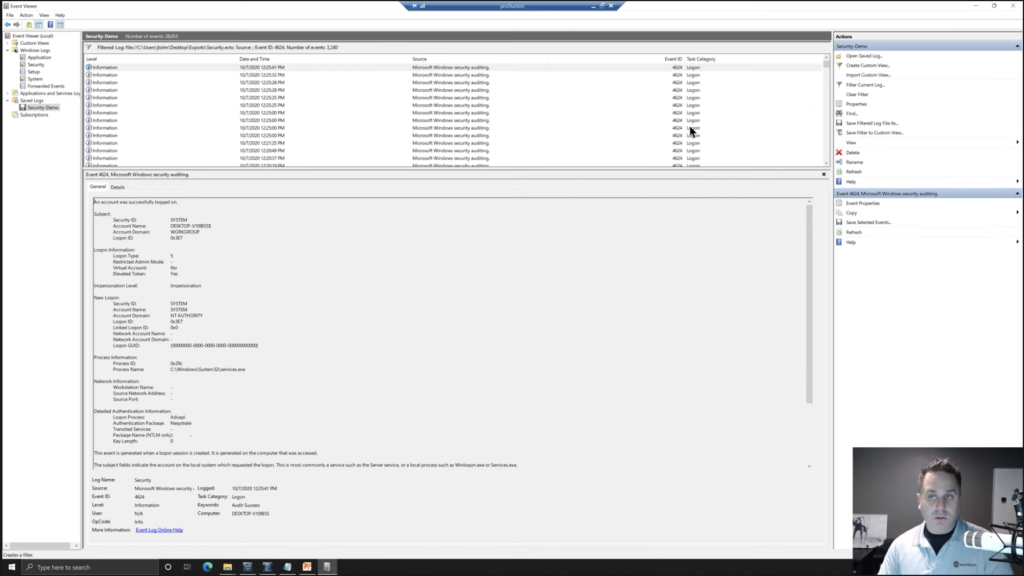
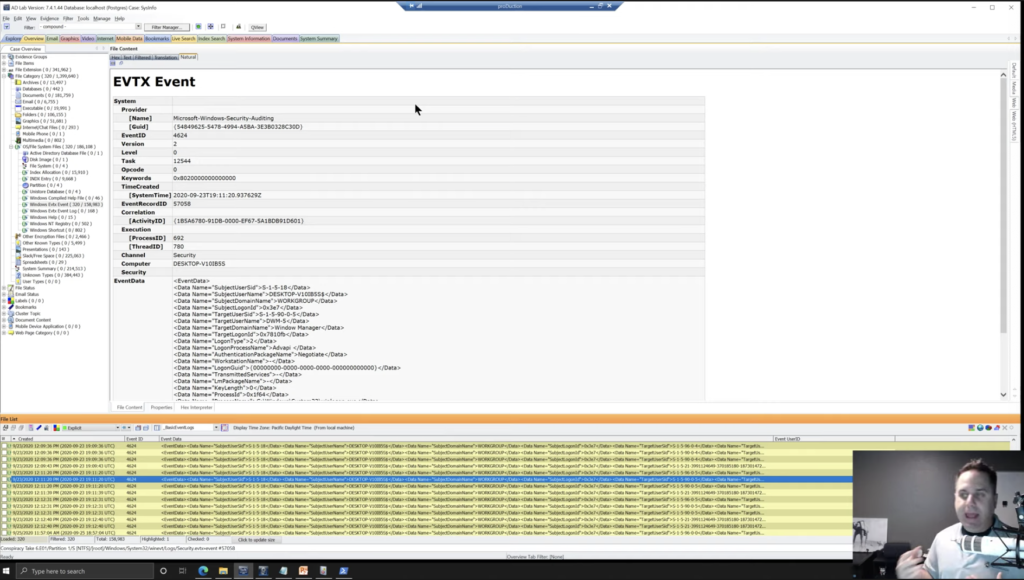
So this is a screenshot here of looking at the security key, and this is using the event log viewer that just comes with Windows, which you can get to, you know, event viewer. Okay. And this, when you open it up on whatever machine you’ve opened it up to, you will see the local logs loaded up. We’ll look at how we can look at logs from another machine here in a second, but this is how you can see it.

And this is where our screenshot is pulled from. Now. That’s pretty small text, so we’ll blow it up a little bit, a little better there for the presentation. Okay. So we just made this a little bit bigger, and we can see at the very top there that our account was successfully logged on. So, great. We can see the various things, the user, the system user, the machine and the account domain, et cetera. What was the log on type? It was 10. We’ll talk about that here in just a second. And we can see like, Hey, it’s a new log on from… oh wait, account name, [email protected]. We can see what the local user directory will be called. In Windows — 10, especially, 8 and 10 and above — it will only take the first five characters of the username to specify directories and IDs and that sort of thing. So we see just the first five characters there.
We can see the account domain, it’s a Microsoft account. And this reflects the kind of movement of Microsoft away from local accounts, even for personal machines and that sort of thing, into their live account system. And this gives the user the ability to sync via OneDrive to various things, various machines. So for example, I have a desktop logged in with an account, and I have a laptop logged in with that account. And so the information within the directories I choose will sync across any other services, such as Edge browser, even the Chromium syncs that information, Windows Mail, that sort of thing, caught up in that OneDrive directory. Okay. So we’re tracking that information here.
The cool thing as well is… let me go down one, these three sections, we’re going to talk about the last one here in just a second… is, notice here that we had a log-on type of 10. Well, 10, as we see over here in this list, if we translate them to what those numbers mean, that’s a remote connection. And so in this case, since I know what we’ve done, this was remote desktop Windows remote desktop RDP that was connected to this box, using this username and, of course, the password associated with it. And we can see that I was in my local network. So that tracks back to my local network IP.
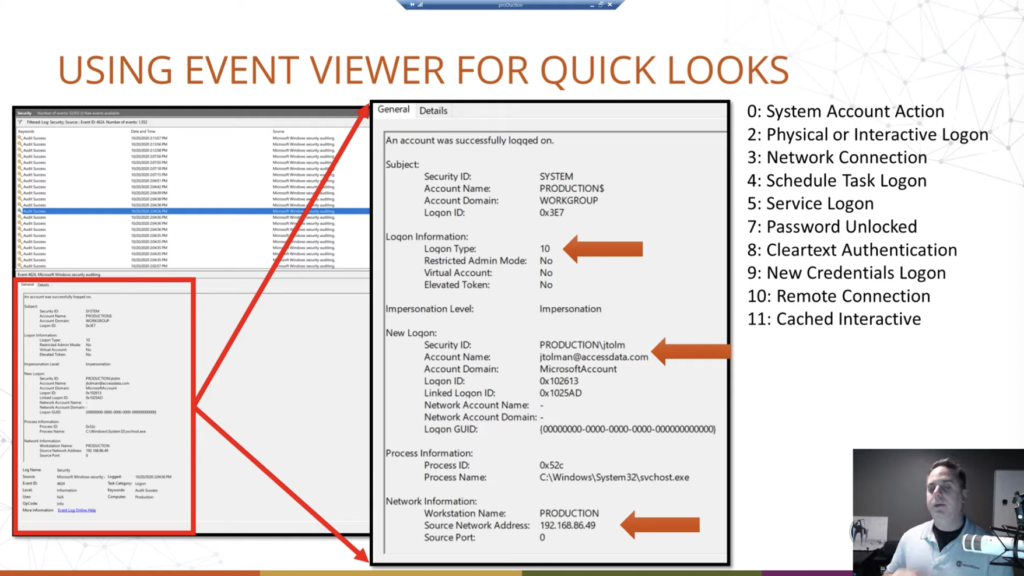
So we can see by analyzing this machine that okay, they logged in remotely log in type 10. We can see, of course, when over here, on the screenshot up here, we have our date and time for which the event was recorded. Then at the bottom, we can see where the connection came from. Okay. So if this was like a business industry, a corporation, large type of network group, you could see if somebody was remote desktopping around, you can track that back, because it’ll be sourced in the event log.
Now we’re going to talk about this here in the next slide, I think. Notice that it’s a Microsoft account and it’s logging in with an email address. Okay. Now that’s going to be your clue that it’s a live account, okay. That they’re syncing with OneDrive possibly, but also what this means is typically, traditionally, in the past, whatever we want to call it, we would track login history, roughly, by using the SAM file. We could go and look at the security accounts manager registry hive, and be like, ah, they’ve created the account. Here is the log on, last log on, the last failed log on, the login count, all that sort of stuff. No longer tracked there, if they’re using a Live account. If it was a local account and it’s migrated over to a Live account, then the old data from the local account will still be there, it will just stop updating. Okay. So you could have like a last log in of two years ago when they did that. It will just stop kind of updating that key. Okay. So we’ll see a screenshot of that here in a second, but something to remember there when doing this.
And that’s why we’re looking at at the event viewer. So we have a better idea instead of just when was the last time, and how many times, we can get when was the last few times — because event logs typically stick around for three to six months; it’s about the best you’re going to get. It just depends on configuration policies that are set up on that machine, use levels, of course, all that sort of stuff comes into play. But, yeah. So, but you can get that kind of historical data. Most of your investigations will be compacting that timeframe usually. So it’s not a big deal.
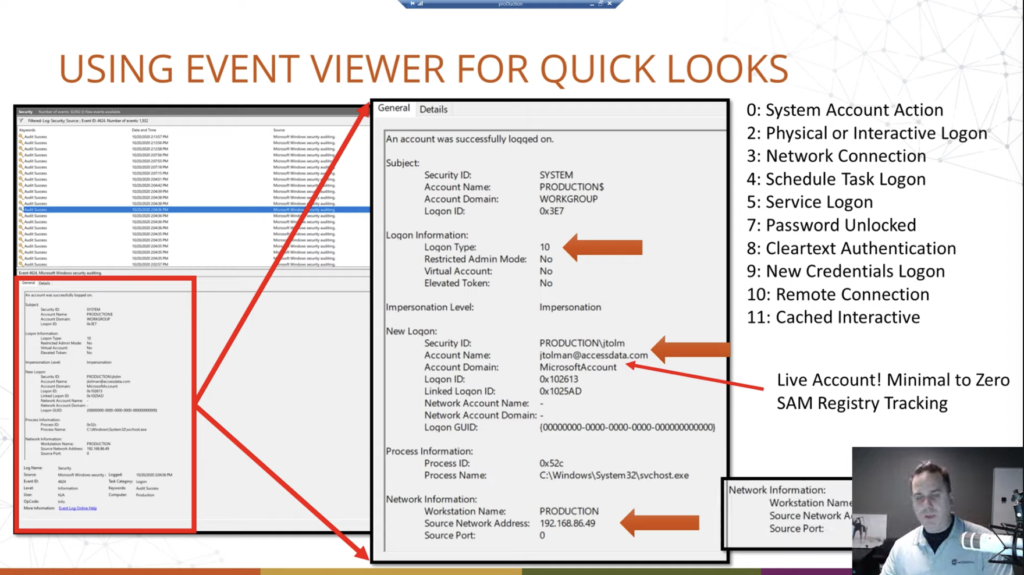
Okay. Then lastly, I included this — and we’ll take another look at it later — but if they are remote desktopping, say, from outside of the network, across the internet. You get the public facing IP of that machine from where they came from. Again, the same idea. So in this screenshot, it’s just the local IP because it was within the network. So it doesn’t need to go out. In this one here, I’m reaching out across the network — the biggest network, the internet — reaching out across the internet and connecting to a machine to use it there. And it records my public facing IP. Okay. Obviously not with the black bar.
All right. So. Comparing here just to illustrate the limitations with the SAM registry file when they’re using a live log in. Okay. So on the left is a registry hive, parsed out. Okay. And we have the bluep user. Okay. And it says last log on time, never. Okay. And then we see various information. Now, the SAM key actually has a little bit more information than it did in the past. We do see the internet username here, [email protected]. Okay. And Lance McClain as the name, but that’s what the SAM file records. If we go over and we look at the event logs, we can see that the account was successfully logged on. Okay. It was a remote in this case that we saw, but it has been logged in locally on this machine as well in this cap. It is a remote. And then we can see of course, [email protected]. It’s a Microsoft account. And you notice that the account that it’s logging into is bluep, which matches up with that.
We can see down here that it was logged in across the internet using, in this case, Windows remote desktop, RDP. Okay. So we have major limitations now. And so for your login tracking, you’re going to be relying even more heavily, even for the basic statistics of log on count. And remember that the log on count may not be the history of the system, and may only be, like, say the last three to six months. Just depends there. But again, most of your investigations will most likely be within that thing. You know, once you’re getting back past that, you know, it starts to get harder as well. So we can see directly here successful log on, not recorded in the SAM. Okay.
All right. First off, before we get into forensic tools, all that sort of stuff. Okay. There’s a bunch of forensic tools that do that. Let’s take a look at what we can use to view event logs in the absence of forensic tools, or instead of, or whatever you want to do. So we know where it is. Now, first off, what we’re going to do is, like a cooking show, I already have it queued up. You can load it into, say, FTK Imager or any other disk browser that you want. Imager is free, and, you know, forensically sound, so it helps you there to minimize changes, but all you need is to be able to browse through the file system.
So we’ve navigated down to our file path, and you can see there’s just a ton of information: dlls, directories, files, you’re in a Windows system area here. And so just a lot of stuff there. And that’s why I cued it up. You can see that the large scroll bar here.
So we go to the logs and we find our files. Now you can see, we have a bunch of log files and these track various things. Security is where our login stuff is. But if we were to scan up at the top, we have applications, hardware, events, so on and so forth. Okay. So a lot of good information that you can find in those event logs. We’re focused on login.
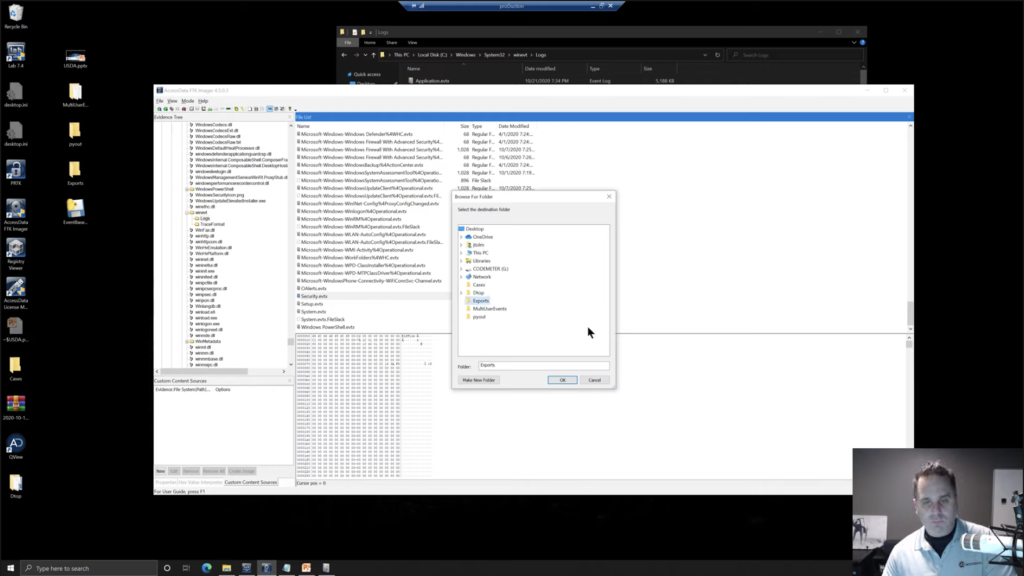
So you’re going through a computer. You want to check it. We’re going to be looking for security.evtx, so we’re going to right click. And we can just export our file and we’ll export it to exports. Okay. I’m going to click. Okay. And okay. So now we have in our exports directory, the security.evtx. We can just open that with Event Viewer, which we have right here. We opened just a little bit ago.
Now, these guys here, if I expand out Windows logs, we can see application security setup system, et cetera. That’s the local machine. Okay. And that may be our examiner machine; we could have exported this from an image, which I believe is what we did. If we were to scan back up here, notice that we have an E01, a forensic image of a drive. We’ve navigated down, we want to take a look at that in Event Viewer, which is cool.
So over here on the right, we can open a saved log and we can navigate to our desktop exports. And we see our security.evtx here, click open. We can give it a name so we can, I give it, like, a security and we’ll just say demo. Because that’s what we’re doing right here. And you can add a description. You can add the other stuff, but we’re just going to say, okay.

And now we are inside the event viewer and we can scan through… and there’s other things in security.evtx, it’s not just log on, log off, but we can see here, here’s a log off over here in the task category, special login. Take a look at that.
Now, one thing when tracking your users. We have a filter option over here on the right. We’ll look at that here in a second. Windows has system users: like, the machine itself has users that it will activate to perform certain tasks. And so not all of your log ins and log offs necessarily will be, like, human users. It can be machine accounts that are activated, logged in, to perform certain tasks and stuff. And that can serve to kind of muddy the waters a little bit when you’re looking at the logins. Okay. But filtering by certain types of logins, if we rewind here in a minute back to the types of logins, we’ll talk a little bit more about those. Certain types are done by users. Certain types are typically done more by system accounts.
So we have this log off here. We can see 4647 is the event ID. Okay. And we can see, okay, the account name was Raylan Givens. We can see the desktop name and we also have the SID. Okay. Followed by the RID here, the RID, of 1001. Okay. And so we can come down and you could look through, you have a log on here, notice that we have an account name of ‘system,’ again, it’s doing its thing.
Okay. And you could go down and look, now you can filter your current logs as well by ID. So you could say 4624 to get only your log ons. Okay. And then you could come down and look through all those, again, system accounts, various things. Most of them, again, are going to be system accounts. The user logs on here and there say, if this was a corporate investigation, they’re going to log on probably in the morning, maybe like around lunch, you know, and then at the end of the day, so yeah.
One consulting thing a few years ago, that’s exactly what they wanted. All they wanted to do was track when an employee was logging into their machine and logging out of their machine, just they felt that there was clock on, clock off fraud, whatever you’d call that, time management fraud, whatever. And so they used that information to show, okay, Hey, you’re supposed to be here at eight o’clock, but you’re not even logging into your machine till nine o’clock. What are you doing for that first hour, or whatever? Okay. And so they come in here, you’ve just got to filter out some of the system accounts because they’re on and off as they have to perform their duties. Okay.
So we’re looking at a custom one. We can go through now. The nice thing is, again, we’re talking about timelining, is we can sort this by date and time to go in order. It should be that way by default, but you can sort your view to either go oldest to newest or newest to oldest, however you want. And you can go through and look at these. Okay. So yeah.
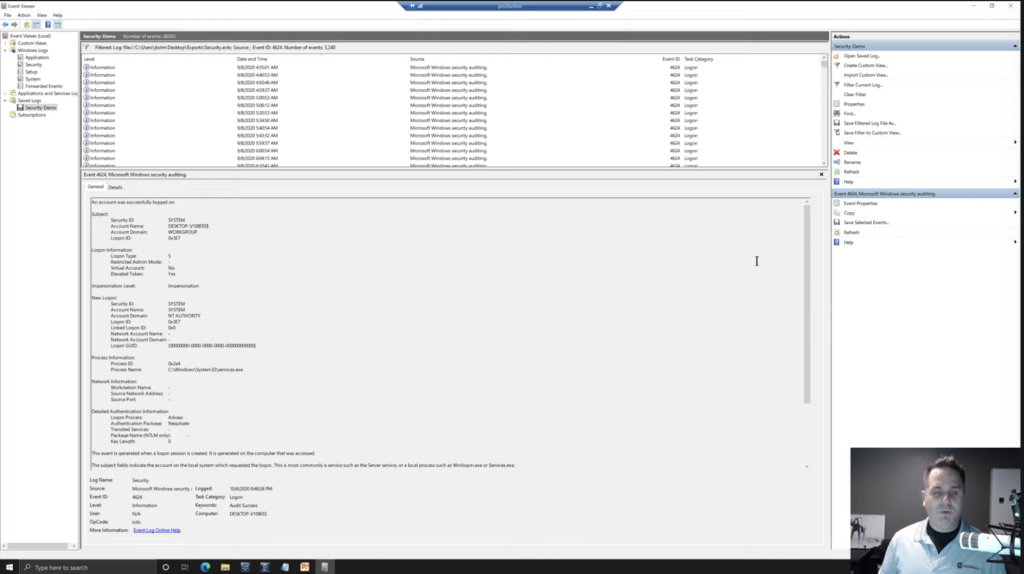
Now this is mostly used for troubleshooting, right? The event viewer is for Windows, it’s not necessarily a forensic tool, although we can use it to run investigations, but it’s kind of a one at a time, you’re clicking, you can see that even here filtered down, we still have what, 3,240 items in our list here. And that’s a lot to go through one at a time. So just remember whatever forensic tool you’re using, will make it a lot easier to go through this.
So let’s back up just a touch. We’ll come back up here and we’ll talk about some of these log in types, because we’ve now seen it. We’ve seen a bunch of system accounts. Okay. But we’re typically more concerned about user accounts. So notice we have system account action, physical or interactive login. So this is one that we want to look at, of course. So this is: I’m at the keyboard type it in, and I’m logging in. Okay. So we can have this physical or interactive login, somebody is at the keyboard, types it in. Network connection can have that scheduled tasks log on. Okay. Again, this can either be scheduled by and for the system or for a user service log on system account. Password unlocked.
So some of these can be paired together, and you’ll see that to where you’ll have multiple log on events and you’ll have like a 27, you know, back to back. And that’s because it’s, yes, it’s a physical interactive log on, but it’s also password unlocked. Or you could have a remote connection, but you still are using a password to unlock it. And so you can get these paired up as well. Clear text system, new credentials, log on, et cetera. Okay. Remote we’ve talked about, and cached interactive. Okay.
So you want to go through and know what you’re looking for. You can filter those out. They are in the event logs there. Now the filter system in the event viewer is pretty involved, and we’re not really going to get into that, beause we’re going to just focus on timelining using various things, such as forensic tools, Python, and we’ve already covered the event viewer. So those are your main log on log off system account view information.
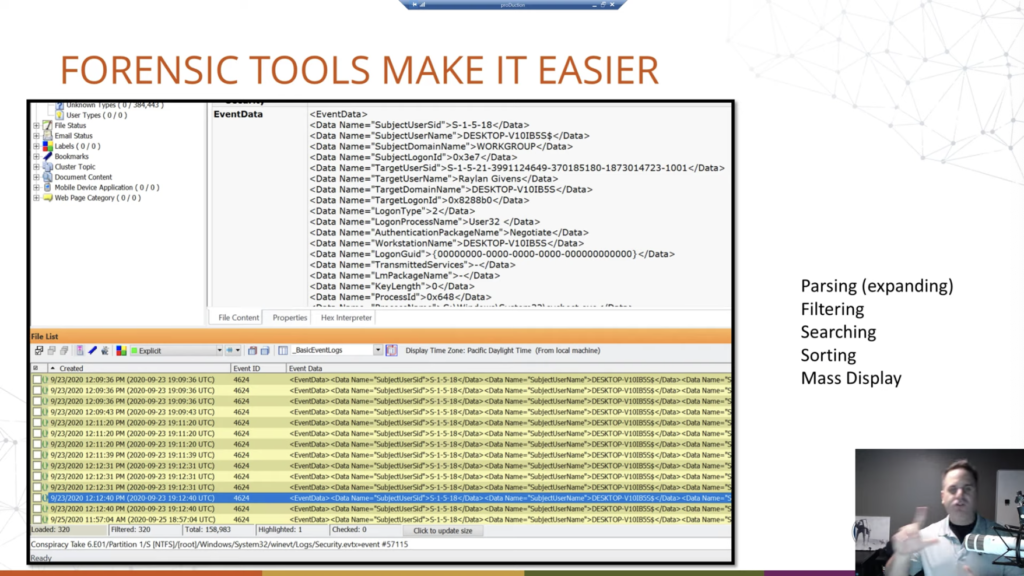
So forensic tools make it easier. Any forensic tool. Okay. So they’re designed to take this data and display it in a usable way. We’re going to show some screenshots of FTK here, but that’s just because what I have access to. AccessData, this is how it works. But we can see these event logs parsed out, down here at the bottom where we have our date, and this is the date the log was created. Okay. That’s useful. Or the event, I should say, not the log, because the log would be the whole file, the event is what we’re talking about. The event itself by the event ID and then the event data that’s shown up at the top, in this structured way. And then also in column data. And the nice thing about having it both ways is you can read the top by selecting individual, or you can view multiple records at the same time in a list.
And again, most of your forensic tools are going to show it in some form of this view. You can also export this out of your forensic tool, into Microsoft Excel or Sheets or whatever you want to look at because, notice, it’s in table data. And then that would allow you to view it, ship it, report it, whatever you want to do. Okay. So, good stuff, makes it easier to go through it. Why?
Well, first off we need to parse it. So if you didn’t want to use Event Viewer, there’s tools out there made by a lot of different people that can view it, but they all have to kind of parse those event logs into a usable thing that they can display. And that does a lot of the heavy lifting for us as analysts, because then we don’t have to do that. They’re doing it for us.
Using a forensic tool allows you to filter. So again, what do we want? We want our log on log off or shut down events. Okay. And so we can build filters to omit that out. We can also build filters to, okay, we want to reduce it down to that. And I only want to see a log on types of 2, 7 and 10. Okay. Quick look, I can build a filter that will show me those things. Okay. Your forensic tools allow you to search, obviously. Okay. Maybe I’m only looking for Raylan Givens’ log on, log off. We could use a filter. Sure. Or we could search either way. Okay. And your forensic tools allow you to do that. Sorting. Do I want to sort by event? Do I want to sort by date? Do I want to sort events within a date? Those types of things. It allows you to do that. Again, fortunately, because of the nature of how the logs are populated, they’re chronological, but you can switch that and sort however you want.
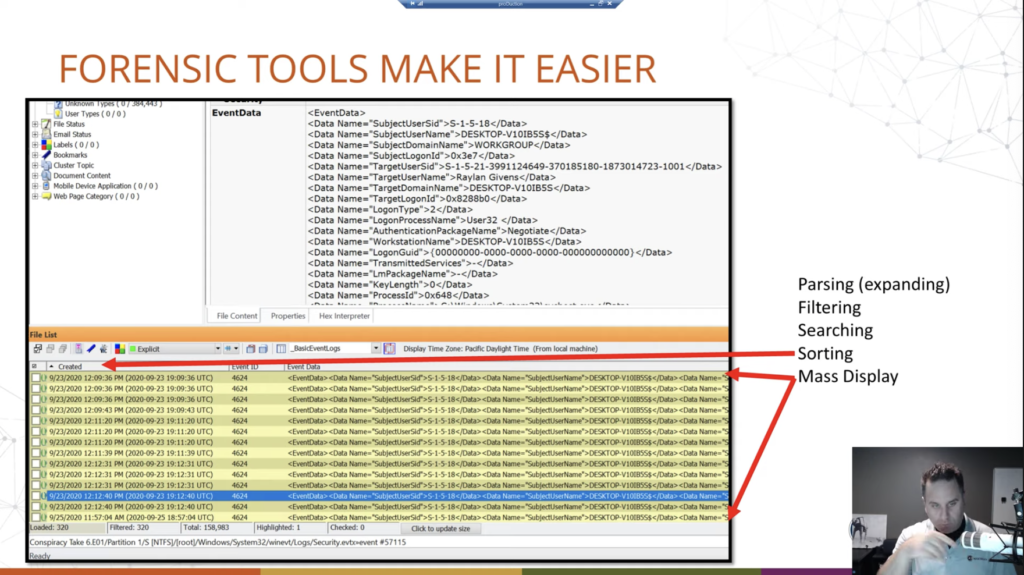
And then again, we already covered it a little bit, mass display. Okay. We just have this where we can view multiple ones all at the same time by scanning rather than, you know, one at a time. One at a time gets tedious. When, you know, notice here, what do I got listed? 320 of them, and I’m running a filter, okay, to only show certain ones. If we saw 320, looking at them one at a time is going to take longer than it should.
OK. Now, Python. So Python is fun, first and foremost. But also Python is, for lack of a better term, a popular scripting programming language within the forensic community. And a lot of your forensic tools will have some sort of Python interface in which to write your own scripts, or you don’t even need them. Let’s be honest. You can write your own Python script to do whatever you want.
So the example that we’re going to show here is just a script that will read FTK exported event records. And why FTK exported? Well, remember I said that the event logs are stored in a way that can, you know, our forensic tools, whatever you’re using, will parse out and display to you in a[n] easy way? So the way FTK does this is, it parses out those event logs that we saw back here, okay, we see them here. These all represent — FTK has broken them out — into these HTMLs. If you use a different tool, it may do it a little different, but it’s going to have some sort of that where it’s displaying it to you in a usable format.

So for example, I didn’t want to write a Python script that also had to break through and parse and all that sort of stuff. The event logs, FTK, other forensic tools already do that for us. Let’s not reinvent that. Let’s take the work they did and write a Python script to take the next step, right? Like Jurassic Park, or whatever. That’s an old reference.
Okay. So for example, this script will read through those event records, those HTML records, getting the information out of it that FTK has pulled out of the event logs. So then we can specify, do we want to look at all the different log on types? Do we want just specific ones? Okay. We can give it a case name, and change file names, and those types of things. Okay. So we just have options there.
So we’ll just show that running. Okay. Just to show that we can run Python, have some fun with forensics, but not just fun. Like, we’re tailoring the data to meet our needs. Okay. In this case, we want an easily digestible timeline of the log ons and log offs for a specific user.
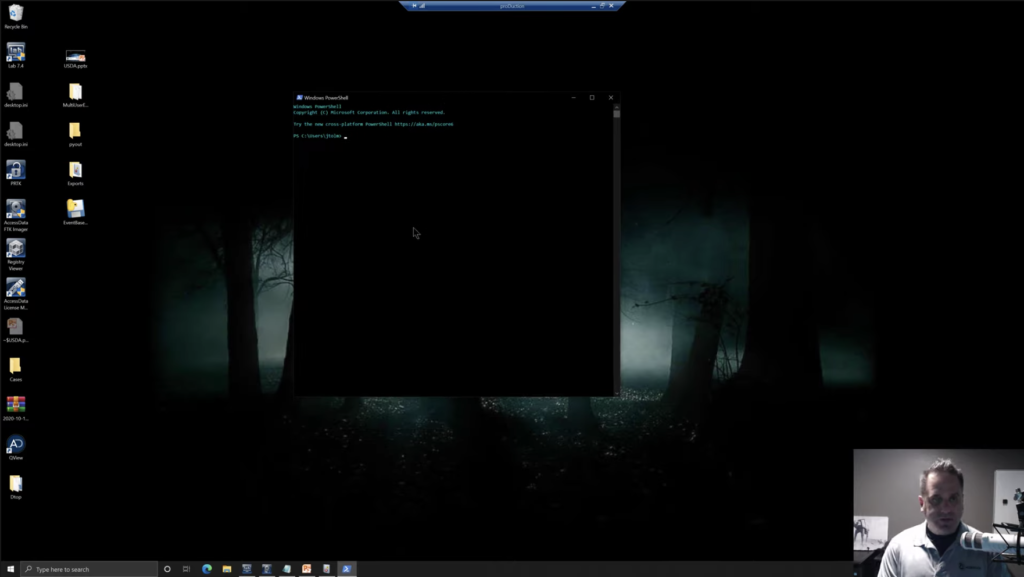
So what we’re going to do, we’re going to open up a PowerShell. Windows PowerShell. Okay. And here we are, Windows PowerShell, and we’ve got a CD to where we’re going to look. So we’ll CD to our desktop here. Okay. Now we’re going to launch our script event base here. So we’ll tab that out. We’ll space. Now again, like a cooking show, we’re not going to go through the hassle of exporting a bunch of items out just to watch the status bar go from a forensic tool to a desktop. All right. No. So I’ve already done it. They’re exported out. These are just, again, the FTK naming convention with the item number appended after it, in the brackets. That’s all we’re seeing here. Okay.
So what we’re going to do is, we’ll point the script at that directory, and then we’ll give it a place to go with the output, and we’ll just give it a case name. Okay. So we’ll do -C and we’ll call it demo here. Okay. And then hit go. And no status bar in this window. Just the way it is. We wait for the sands of time, the little hourglass to go away, and we can open up our output. We see a little HTML page, and we’ve generated a pretty clean looking timeline of the users on our machine in order.
So again, we gave it a case name of demo that just enters it up in there. We have a report date and time; the computer name that this stuff was on. Users that we recovered, omitting the system users. In this report, you can include them if you throw in the -L: all log ons. Okay. but by default, the script will narrow it in to just your human users. We have a total log on count of 17, the number of logins based on user, just for account, for you. And then by default, again, this is only going to return seven: the password unlocked logins. Again, that can be changed in your script settings, in this case that I wrote, but by default I chose seven. It just sped it up, shortened the report a little bit. And again, remember if you log in with a 10 or remote desktop, you still need to use a password.
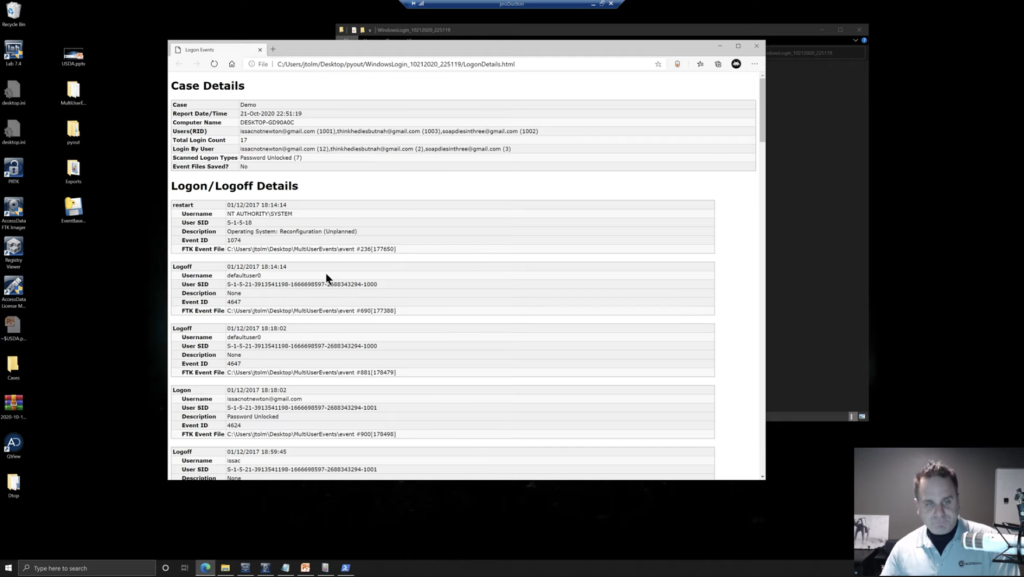
If you’re a physical login, you still need to use a password. So a lot of times your twos and your tens will be paired with a seven type log in, a password type log-in. So this kind of zeroed it in. We could of course open that up. Okay. So we can see a restart, and a log off and a log off. Now, again, this is just where the logs started, but some of this is install of the system. This was a brand new system that I was running through. And so you have the default user here and some different things that are being registered. But then we can see a log on by this user, was password unlocked, because remember we restricted it down to that. Okay. And you just have log ons, log offs, restarts, and different things in here.
We also see the SIDs and the RIDs in here for the various users. Okay. Remember that only the first five characters of the username are stored to use within the domain. Like we saw production slash… I think it was bluep that we were looking at, or was it jtome? Okay. And here with the log off, you’re getting that only the first five. So you’d get, think, and you would need to look through either the event logs, maybe this timeline, whatever you’re using. Right. Whatever you wrote. Okay. And you see [email protected]. Okay. And we can see that information.
But again, we have this chronological list of the output that we can now append to our report. Okay. And it’s got rid of a lot of the stuff that may clutter it, and you can pair this with your more detailed forensic report. Okay. You know, you would come back into whatever forensic tool you’re using and maybe look at whatever and start appending different things to your report. But that’s just a clean, easy way, quick way, to read it. And again, what we’re doing is we’re pairing Python, our forensic tools, our knowledge of the event logs, to build this up. To kind of paint the picture that we want to paint. Okay.
Lastly, here, just in closing again, I mentioned that a lot of your forensic tools will have some sort of Python ability built into it. That is not, you know, Python is kind of just growing within the forensic community. FTK is the same. Like, we have that Python, it’s really robust, and you can just run it in, even if you don’t know how to run Python, it’ll just, you just, you can run a script through it, parse evidence format the way you want it. Okay.
Other tools will handle it differently. But again, the nice thing is you don’t really have to know Python to run stuff like that. If you need output, find somebody who knows it, have them write it, and you can create timelines using event logs like this. Super handy for tracking, again, user behavior. That’s what we’re doing in any investigation, is determining the behavior of the user that we are investigating. So, all right.
So hopefully you got something out of this. Hopefully there was some new information, some interesting information, maybe inspired you in some different way to go out and do something different. That’s cool. I think given the format, I’m probably around to answer questions. If not, my email was in the presentation that [email protected], feel free to reach out, shoot me an email if you have any questions. All right. Have a good day.