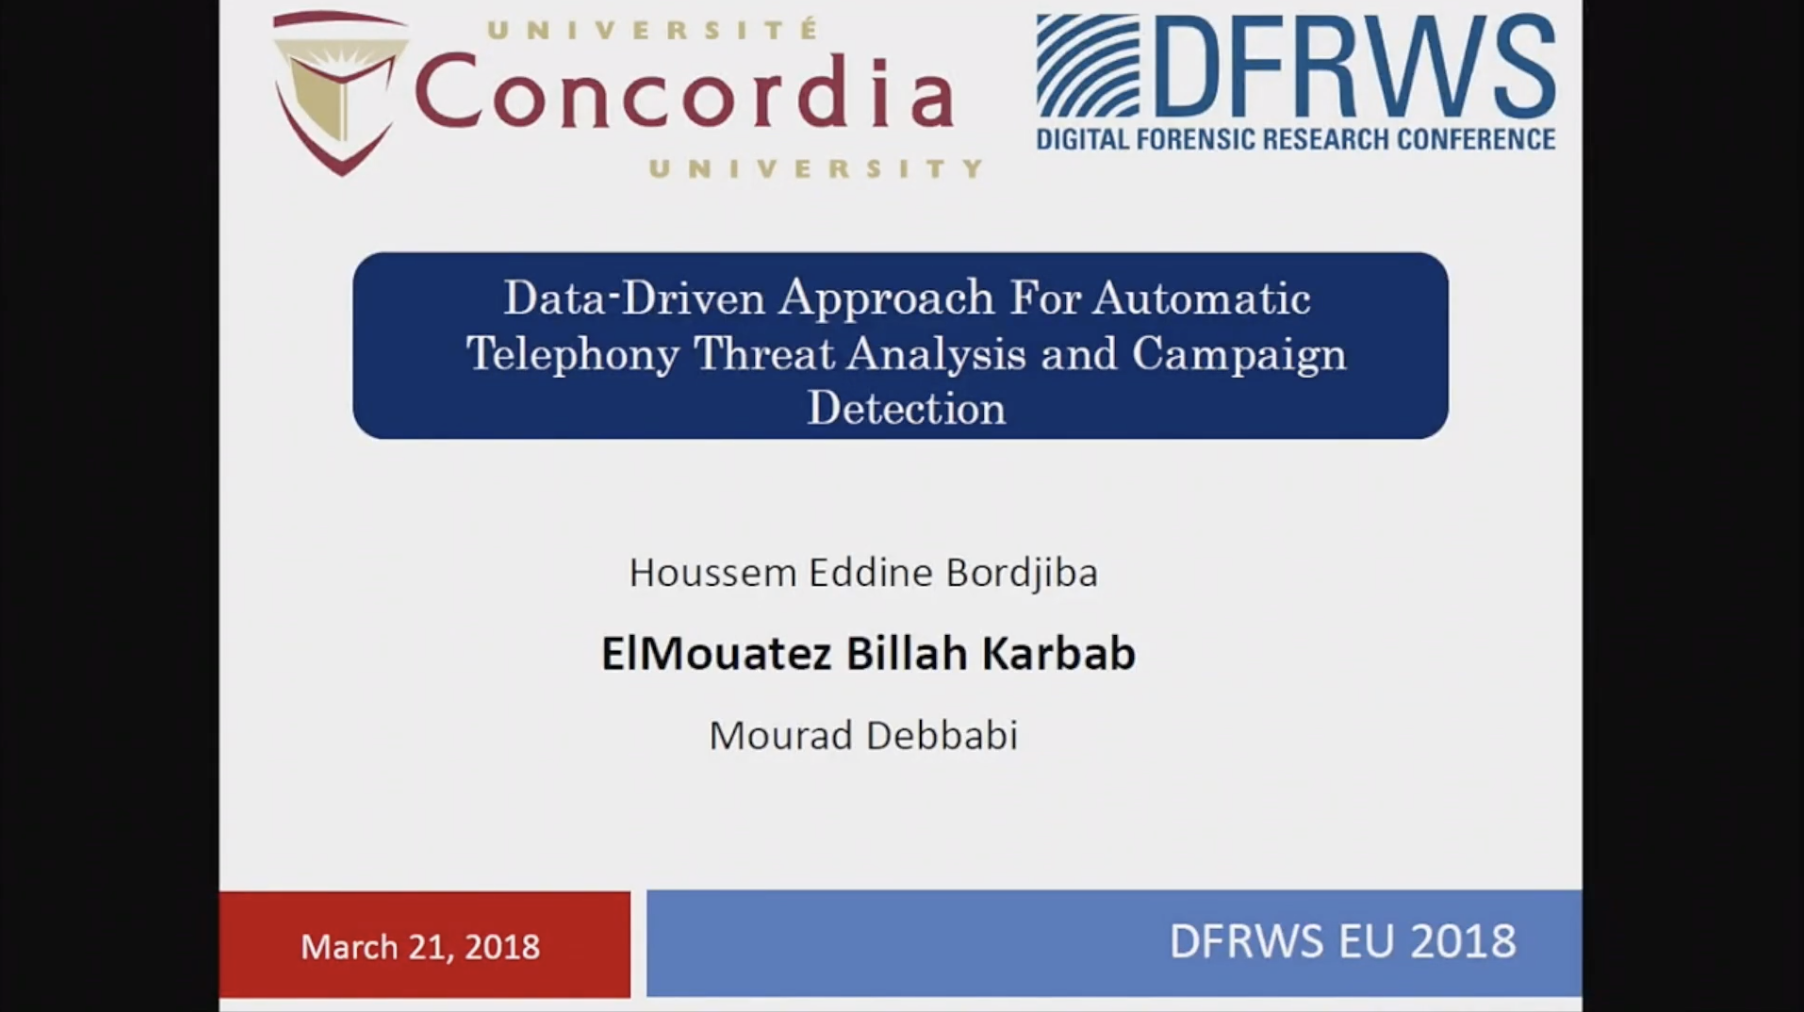
ElMouatez Billa Karbab discusses his work at DFRWS EU 2018.
Elmouatez: Hello back. Yeah. I’m here the second author, and the first one couldn’t make it. This is why I’m presenting. Thank you.
This work is entitled ‘Data-Driven Approach for Automatic Telephony Threat Analysis and Campaign Detection’. The agenda will be: introduction, where we define our problems with the problem statement; after, we discuss framework architecture, the implementation; then we provide some very first results; and after, we conclude.
Start with the problem. So, we have a lot of complaints, telephony complaints. In US, we have about 300,000 complaints every month, about robocalling. I mean by complaint, telephony complaint – so we have phone number and we have some texts about people complaining about this phone number. And they can give you some metadata let’s say. They give me this caller ID, some [extra] information. The problem here … also, we have millions of complaints in US alone and this is only for government complaints. There is other sites where there are open, [01:32], where people were complaining. So, it is million. And this number is increasing, not decreasing, and it is costing lot … I mean, not the complaint, but the telephony scam.
The problem statement here, can we reduce this complaints to detect … not … detecting or prioritize what are the scams, what are the top scams, and can we cluster these scammer or complaints?
Yeah. Because we have different sources, we are looking for collecting these complaints from different sources. So, getting them clean and sorting them. We are use them to generate a timely threats intelligence, and we also trying to geolocate, and the last thing is we trying to detect campaigns. People that they use different phone numbers to do the same thing. For that, to answer, as a response, we develop [TAINT], which is a framework that collects, store, analyze complaints, and try to give insight to the investigator, to the TSPs, telephony service providers, an insight about the telephony abuse, automatically, without any manual use.
So, this is one. The second thing, we are trying to detect campaigns. And we evaluate our system on five million telephony campaigns. This is only the evaluation, but we also have feed, which is used for other purposes. On span of seven years.
So, as architecture, we get data from our partners. Also, we collect data from free sites, where the million … some sites, they are open, you can put complaints there. We collect data from there. And collecting data from sites means [crawling]. [Getting there … getting …] so, sometimes you get blocked, so it is … [03:59].
The architecture is like this. We get complaints. As I repeat again, complaint is phone number plus text plus other metadata about the abuse of this phone number. We classify this complaint, whether it is really complaint or some just simple text, people that put in something. There, we have an [SVM] classifier that define … binary classifier between – this is valid complaint, telephony complaint, or not. This is first [done].
Second … I don’t know if you … yeah. So, here we have our classifier. Complaint, is it valid complaint or not. Then, we correlate with open-source data to … open-source mean getting this data from government, it is open, available, [04:58] to enrich our data, using this sources. So, we extract features for each phone number. This phone number, we built badness score. So, for each phone number, based on the complaint that we get, we give it, let’s say, score. This is bad, this is not bad, but it is numerical. Not …
And the technical thing we use linear regression to do this badness score. And the goal is to prioritize that for the investigator or the TSP, that this is more than just another phone number.
The final stat, we do what we do is we get this phone number and try to find any correlation between them, try to cluster them. Even they are different phone numbers, let’s say they are part of the same, they have the same [threats]. We found some multiple phone numbers that are targeting some banks, and specific banks, let’s say RBC, Royal Bank of Canada, or something.
So, this is the campaign analysis. The final thing, everything is provide in GUI, web GUI for the end user. We start by text classification, which is simple text classification, where we [stem] … I mean, remove stop words … so, from this complaint, and we define if it is valid or not. We are using SVM, and for feature extraction, we mainly used [ITF-IDF], for pre-processing. So, yeah, we are using SVM for the classification. When we get the complaint, we use this binary classification.
So, the correlation – why we are using? Because we are focusing on North America, we are getting this data from the Canadian Numbering Administrator, and other [admin] institution, where we can define with high accuracy that this number is part of this city or this province, and also, because they have special number in North America, and also, we can see …. I don’t know here in Europe … we can see also, a certain accuracy, which provider, with only from number. And because … yeah, it is viable. But this data could change over time. This is what we have some false positive sometimes.
So, we have now complaints, we have [07:48] … we enrich the data, it is valid complaint. Now, we do phone number and all the complaints and metadata that we get, and as [a features]. So, we have lot of [08:01] numbers. Here, we are doing correlate … I mean, trying to find any similarities between the phone numbers, in terms of texts, I mean the type of complaints, and the type of metadata. So, we are doing the [08:16], similarity between each features, vector, and for fast [08:22] we are using LSH, locality-sensitive hashing, so it is doing this fast. Even we have five million, it is seconds, maximum hours. I mean, in our five million, you can reach … I think we did 15 minutes. Small server, so it is fast.
This is the thing. We do the similarity using [Epsilon], where we do this is similar or not. We end up with this graph, where we see the dots here are highly connected phone numbers. So, they are really similar. This is what we define as community – these phone numbers are very similar. Even in text and other features.
We have this huge graph, we want to extract these dots or what community, highly dense, we want to extract them and define them as suspicious community. For this series, we are using community detection algorithm, that you get as import the graph and extracts this highly dense … and well-known paper in 2008. And it is very fast.
So, yeah, and here we are doing … how to do it … I mean, in real-time. So, the implementation, we are [want] something efficient, [generally]. So, we get the complaints, we classify them, store them, then we use some sophisticated tools like [Kafka] for streaming, we do the most … the graph analysis, we do it in Neo4j, it is [graph-based] graph database. It has all the algorithms that we need, it is fast.
We use the correlation to arrange our data, and the final, we use, the final thing we use elasticsearch, where it is indexing based on [10:33]. The final thing, everything will be provided for the end user.
So, let’s look at our dataset. [As I said], that it’s five million complaints, over seven years, from different sources. And we have 80,000 unique numbers. And this is the distribution over time. Here, we don’t … it is increasing first, and see … and this is … it is gap, because we didn’t receive data, we just selected this data. But we have data, it is increasing always, even in 2017, it is really increased.
Yeah. This is the distribution, because we are in North America, most of them are from United States and Canada, and this is toll-free numbers, phone numbers that are not part of any specific place. And these are from all over the world. You see that 7% of international complaints. So, these phone numbers from other countries.
And that’s an interesting thing that most of them … I mean, after we did the analysis with the filter, this is [the fruit]. Most of them are from Jamaica. It is fishy. And we see Italy there. Yeah. [laughs]
And this is outside North America, and here we see the cities, distribution, we can see the phone numbers [actually]. These are more … most used … most complained about … I mean, more complaints about these phone numbers. And we can [geolocate] them.
Here we see the type of abuse for each phone number. The top abuse, this is people that pretend to be [the S1] or Bank of America. So, they are conning people, pretending to be these guys. And as for the classifier that we talk about, it’s … in our evaluation [side], it’s given us good results, as you see here. And the regression, where we used badness score, this is very good results that we …
But beside this … this is the … using this five million, we take this campaign, and we report them. So, first, in fraud complaints, people are pretending to be the IRS, the Treasury Department of USA. There is also the telemarketing people. But there is also something in Canada like political campaign or we find the NDP, people with different phone numbers, but at the end we found that they are the same guys, the same party.
And also, we have the scam.
Everything is provided as a GUI for end user, and this is used by TSPs, [13:52], telephony service providers, and some law enforcement.
As a conclusion, we … there is lot of people are [shouting], in text [14:08], we are using this [shout] to find … this texts to find, to detect abuse or to cluster abuse, telephony abuse against people. So, for this reason, we propose this framework, and it is automatic, for … in the collection, in the aggregation, in the [RSS], everything is automatic. We evaluate it in large data sets of five million complaints. The performance is good in both classifier and the badness score. And we detect over 1,500 complaints, and we report them.
Yeah, that’s it. Thank you.
[applause]End of transcript