Hello, and welcome to my DFRWS US 2021 talk about leveraging Intel DCI for memory forensics. My name is Tobias Latzo and I’m in the security research group of the Friedrich-Alexander University Erlangen-Nürnberg in Germany, which is led by Felix Freiling.
Memory forensics becomes more and more important in today’s digital forensics. There, you can see what processes are running, you can find encryption keys, or you can even find decrypted data. You can see network attached storage, or also open network connections to, for example, cloud providers. Furthermore, there is malware that does not exist on the disc, but only in memory.
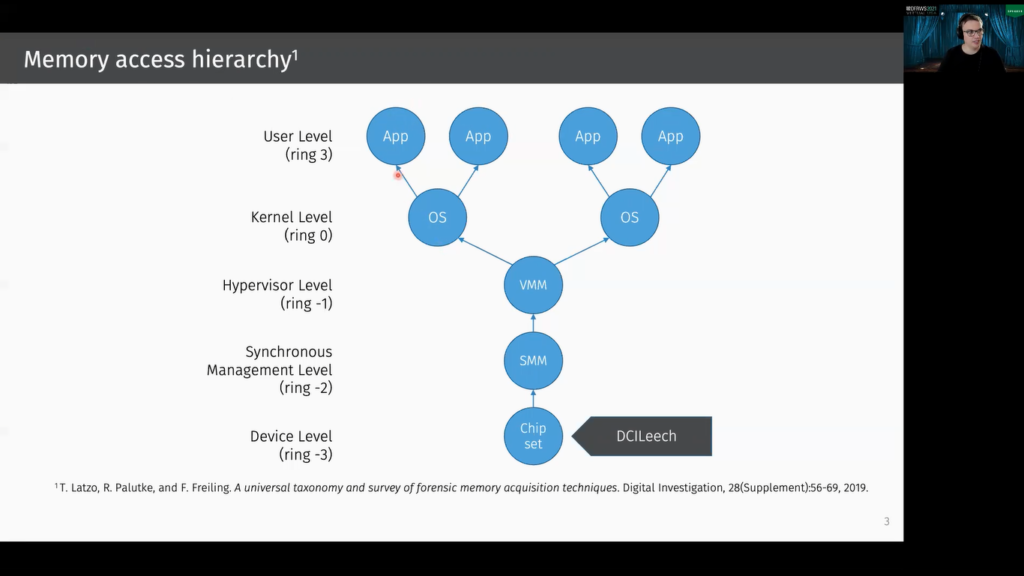
In 2019, we published a universal taxonomy and survey of memory acquisition techniques and tools. Here I want to show this for the x86 architecture. The blue circle represent address spaces, and an arrow means “has access to”. At the very top, there are the applications address spaces, and of course the operating system kernel can access the address spaces of the applications.
One layer below, here we have the hypervisor level, and if we have multiple operating systems, the machine monitor or hypervisor can access the address spaces of these kernels, and it can also access the address basis of the applications, so this relation is transitive.
Below the virtual machine monitor is the synchronous management level for x86. This means this is the system management mode.
And one layer below there’s the device level, and here is also our DCILeech tool that I want to introduce in this talk. And most tools on this layer are basically DMA based. Most existing memory acquisition tools are on this layer, on the operating kernel layer (so often implemented as kernel modules), or in the hypervisor.
Okay. So when we want to acquire a system’s memory, we want to have a good snapshot, but yes, what makes a good memory acquisition tool or technique? Therefore, I want to refer to the three criteria defined by Vömel and Freiling.
The first criteria is correctness. Of course, the snapshot should be correct.
The second criteria is atomicity. This means there shall be no inconsistencies that are due to interleaving memory acquisition. So basically because of the memory isn’t read at once. In 2019 Pagani et al., also showed that these inconsistencies are kind of frequent and do actually have a negative impact on the analysis.
The third criteria is integrity. This means the content of the memory shell in the best case not be changed by the memory acquisition tool.
So then let’s take a look at Intel DCI. First, what is Intel DCI? DCI stands for direct connect interface, and it’s a technology by Intel that allows to debug the computer or the hardware using a USB A to USB A cable. It’s meant for a close chassis JTAG-like debugging, and usually such in-target debugging can only be done using expensive, special hardware.
But as already said in this case, the only thing you need is this kind of special USB A to USB A cable. DCI is very powerful, basically you can think of it like a GDB on a hardware level. So it’s also possible using DCI to debug the firmware, the system management mode or the hypervisor. Since DCI is so powerful, it should not be enabled by default.
Another advantage of DCI is that you don’t need any software on the target side, so it’s completely operating system independent. And the cool thing is that you need to stop running the CPU while you debug it. This also means that you actually can acquire atomic dumps. And because of this we want to use Intel DCI for memory acquisition.
There’s some previous work on Intel DCI, above all Goryachy and Ermolov are the pioneers in this area. They showed how to use Intel DCI for security research, and they also demonstrated how to use DCI for debugging the Intel Management Engine. There is another interesting talk by Maggie Jauregui who showed how to use Intel DCI for debugging the UFI firmware.
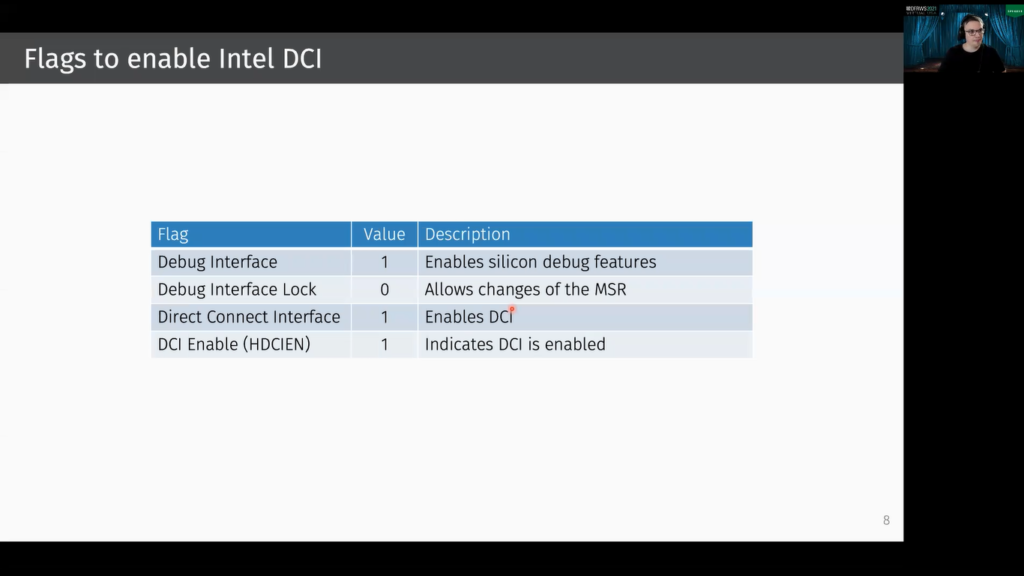
As already said, DCI should be disabled by default. This means we first need to activate it. And to activate it there are some hidden firmware flags that need to be set. And on some platforms there’s also a vulnerability that allows you to write during run time into the corresponding registers. Then it’s also possible to activate DCI from the kernel or from the UFI shell.
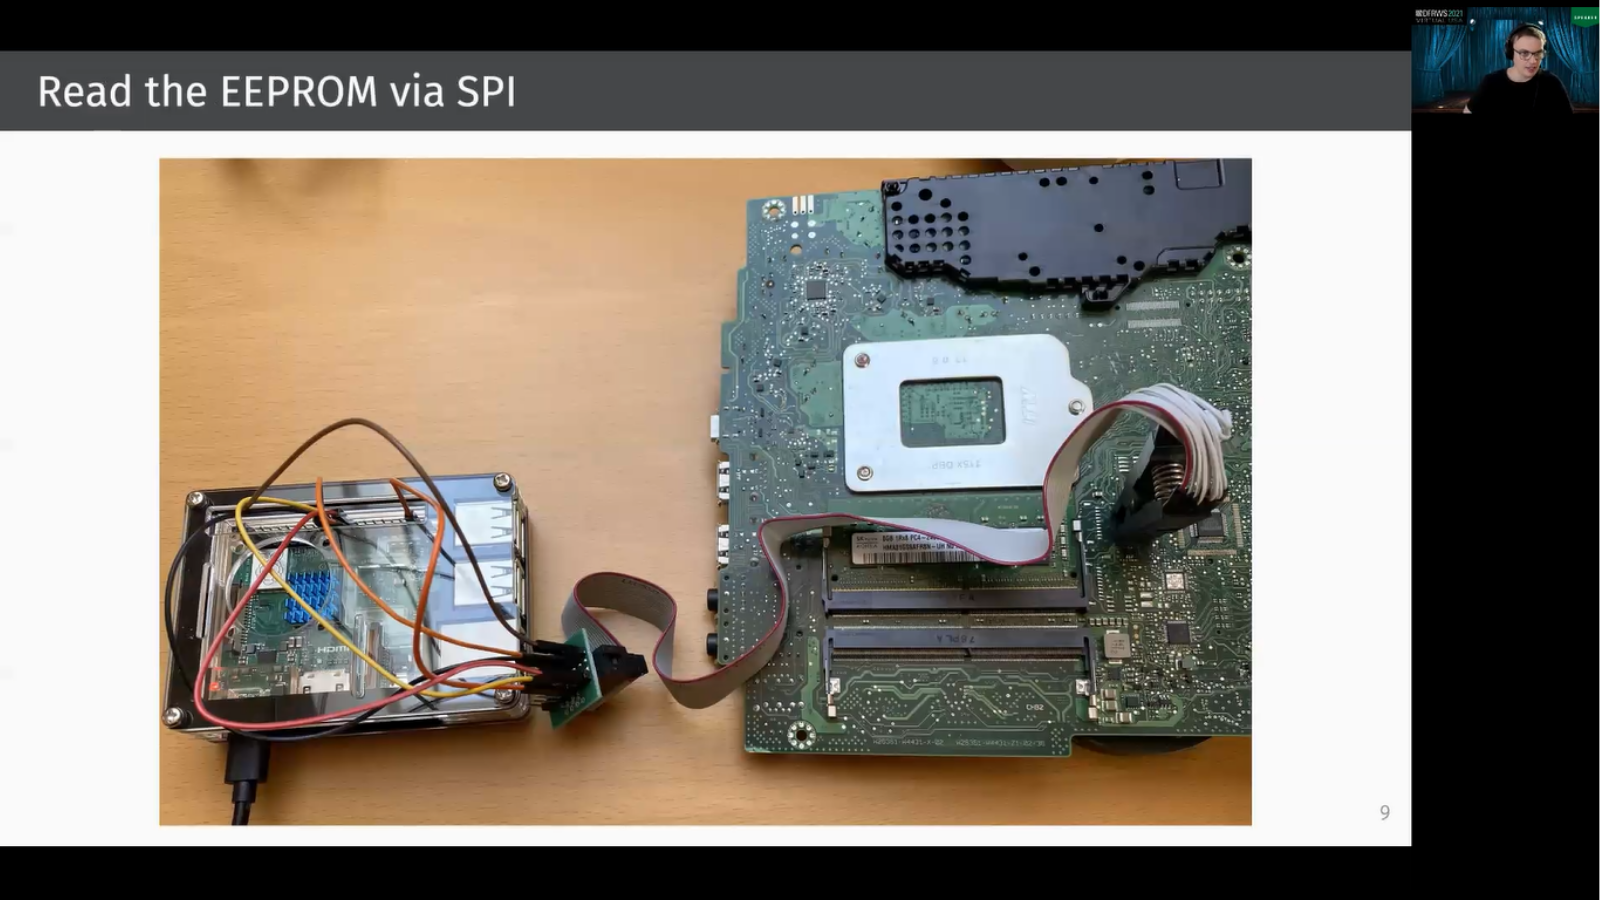
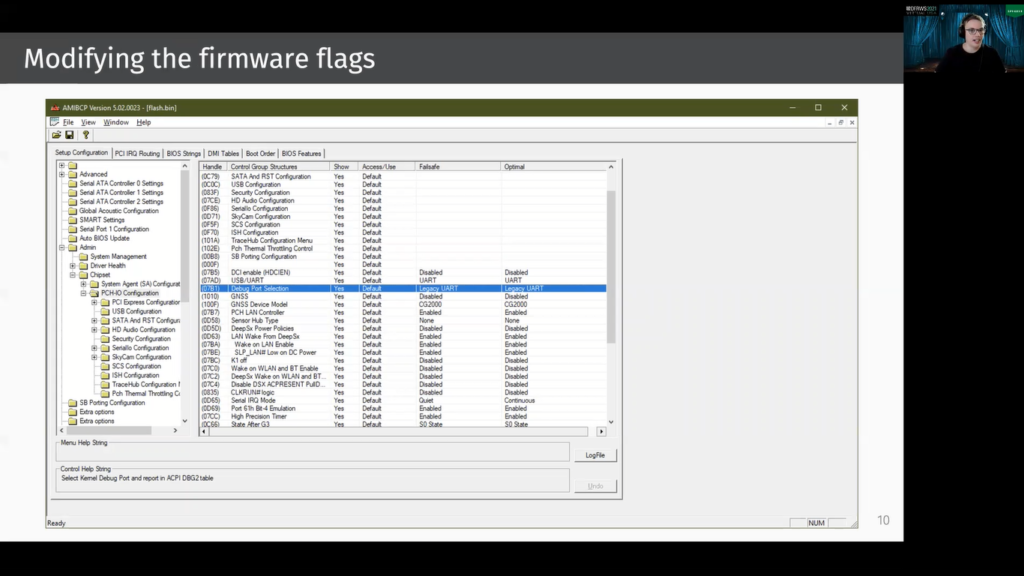
But in our case this was not possible. We had a [inaudible] system where we first needed to read the EEPROM via SPI. Therefore we use this Raspberry Pi and then we could modify the corresponding firmware flags. Therefore we use the AMIBCP tool and the EEPROM can be flashed with these modified values.
What’s then important is to go into the firmware settings and to hit “reset to default”. This is needed because the current settings are stored on the CMOS chip. Restoring to default causes that the values from the EEPROM are used.
Okay, then let’s take a look into our DCILeech implementation, but first the term PCILeech refers to Ulf Frisk’s PCILeech project. We make use of this framework because it easily allows us to benefit from all of his features. The features are, for example, you can read/write memory, you can inject kernel code on the target, you can push and pull files, and you can basically bypass the Windows login screen, so that you don’t need to enter your password. And all you need is to implement the rawtcp device, and therefore you need to understand this kind of message. This means you basically say you want to read or write from or to an address, and then you give the size in bytes.
However PCILeech, for some features, it expects injected code to be executed and this especially applies to kernel module injection. PCILeech then waits for a specific physical address that is written by the injected code. However, when you use DCILeech or DCI, we help the CPU. So first the CPU does not run, so basically PCILeech is then waiting forever.
And for this reason we extended PCILeech by two commands: so here, DCI_GO and DCI_HALT and when DCI_GO is sent, the CPU runs the injected code. And after a second, the DCI_HALT command is sent, and in the time between there was the high chance that the injected code was executed.
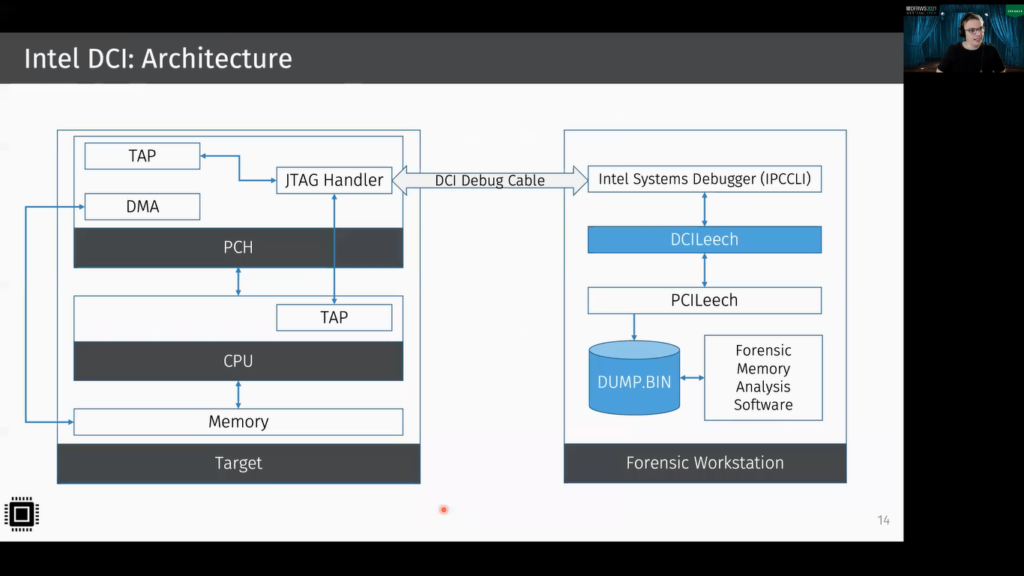
So here you can see the architecture we used. On the left side, you can see the target system and on the right side, you can see our forensic workstation. The two systems are connected via this USB A to USB A cable, and this is connected to the JTAG Handler on the platform control hub. And the JTAG Handler itself is connected to multiple test access ports. The test access ports allow to test or debug the corresponding component. And it’s also possible then to read the memory.
On the forensic workstation, there’s PCILeech installed, and our implemented PCILeech rawtcp device, which we call DCILeech. And this implementation then makes use of the Intel Systems Debugger, which then implements Intel DCI. So now it’s possible to use PCILeech for dumping memory. And this memory can then be dumped using a common forensic memory, and uses software such as Volatility.
Okay. Then let’s take a look at the evaluation. First correctness: to show correctness, we need to show that DCILeech is reading the actual content of the memory. Basically for existing memory acquisition tools, we can assume that they work properly.
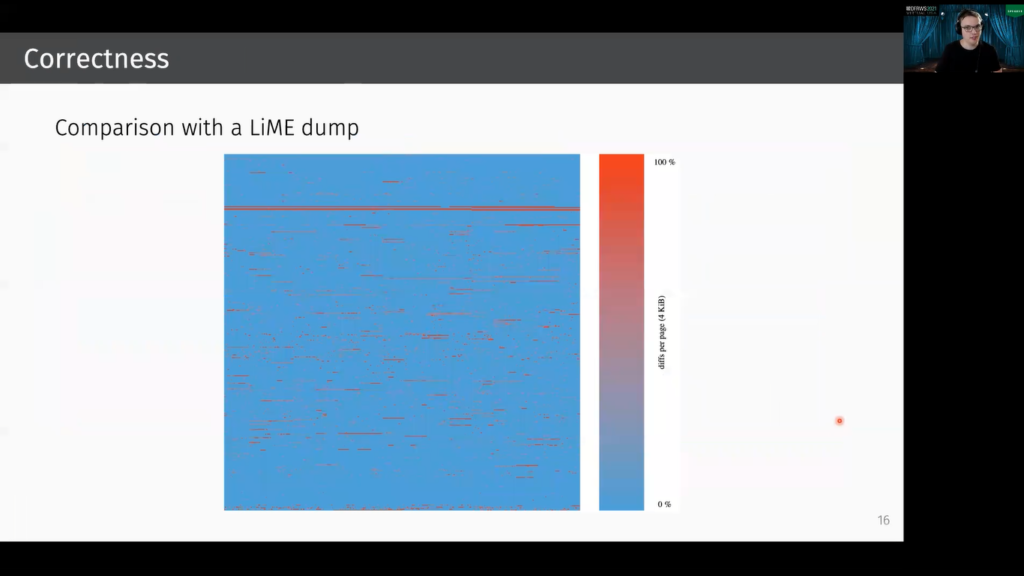
So now we compare our memory snapshot that was dumped with DCILeech, with a snapshot that was created with the well-known kernel level acquisition tool LiME. In this graphics, you can see a visualization of a page wise diff between the LiME dump and the DCILeech dump. Addresses are here growing from the bottom left to the top right.
And each pixel represents a page. The more reddish a pixel is, the more diffs are occurring in this page. In total about 38 megabytes are different, and this is basically in the same order of magnitude as when two LiME dumps are created one after another. LiME is a kernel module and does not dump the memory atomically, so there are concurrent processes that change memory. And yes, this is the explanation why there are diffs. So I think basically we can say DCILeech is working properly.
So next, since we want it to be compatible to PCILeech, we tested the following payloads: of course, the most relevant payload for us was dump. So a memory snapshot is taken. Then the next payload is the kernel module injection, this is done via kmdload, and it was also working. And we tried to push and pull files with lx64_filepull, respectively _filepush. And we were able to unlock the Windows screen (so without entering the password) using wx64_unlock.
Goryachy said in one of his talks that SGX debugging should be possible. So for digital forensics, this would be very nice, so we took a look into it. For testing, we wrote a simple test program that loads the well-known Lena image into the protected enclave’s memory.
Therefore we use the Intel SGX SDK. To find the address one first needs to find out the physical address of the enclave page cache. This can be done using the cpuid comment. And to actually read the memory we used the ITPII function, edbgread, which probably stands for enclave debug read.
However, we were only able to test this with the debug profile: for the release profile, you need an attestation key from Intel. However, there’s the set debug opt-in function, which sets the debug opt-in flag in the SGX thread control structure. Then the enclave can probably be debugged, but we are quite skeptical that this really works and this should be tested in future works.
Here you can see a sketch of how to do a digital forensic triage using Intel DCI. Inspired by triage in medicine, digital forensic triage aims to prioritize the preservation of evidence. And I think Intel DCI is quite good for that.
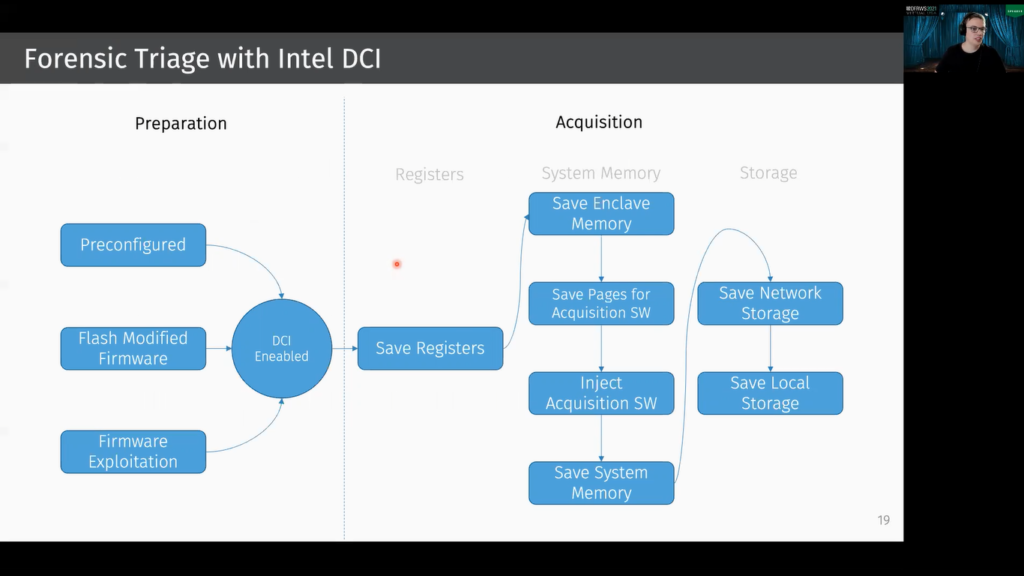
So first you need to prepare your system. You need to basically activate Intel DCI. Basically there are three possibilities: you can configure it in the firmware settings (if the firmware settings itself allow it), you can flash modified firmware as we did, or probably you can search for our firmware exploit that allows to enable it.
Then you can first save the most volatile memory, which are the registers. And then you can save the SGX enclave memory, if it exists.
And since memory acquisition using DCI is very slow, we advise to inject the special memory acquisition tool on the target, and the pages that are used by this memory acquisition software should first be saved, then the memory acquisition software can dump the system’s memory. Afterwards, the analyst can save the network storage, and then of course the local storage.
So let’s conclude this. Let’s first take a look at the results: our evaluation revealed that DCILeech is working properly. Since we need to stop the CPU for debugging, we can actually acquire the dumps atomically.
On the target side, there’s no software required, so integrity can be taken as granted. We can also reach registers, this also includes debug registers, so there are encryption technologies or tools that hide encryption keys in special registers, for example, in the debug registers as TRESOR does, and this can be broken with Intel DCI. Furthermore, we were able to read SGX enclaves protected memory. However, we could only test this in debug mode.
One of the biggest disadvantages of Intel DCI is the poor performance. So we were only able to acquire the system’s memory with about 70 kilobytes per second, and SGX memory could only be done with about 4 kilobytes per second. A big challenge is of course to enable DCI in the first place, so the usage is quite limited and it can only…it’s not really good for on-site investigations.
However, one could imagine kind of forensic-ready systems for companies that can safely enable this feature for specific systems. Furthermore, evil maid attacks are also possible. However, if you enable DCI, you should be aware of the risks and of course it should be well secured.
Okay, then thank you for your attention.