Winner of the Best Student Paper Award at DFRWS-EU 2022! Muhammad Haris Rais describes a step-wise approach to analyze the memory of specific PLCs, and subsequently find a generic framework applicable to all PLCs. By following a methodology that focused on the functional layer of PLCs instead of reverse engineering the firmware, the research team analyzed the digital forensic artifacts available in a common PLC, Allen-Bradley ControlLogix 1756-L61.
Session Chair: So we move to the next speaker, which is Muhammad Haris Rais from the University of Virginia. And while he’s setting it up, the title of their paper is Memory Forensic Analysis of a Programmable Logic Controller in Industrial Control Systems. So it’s not too far away and I’m really looking forward to your presentation, Haris Rais, to see how you are analyzing the data from those programmable logic controllers. The floor is yours.
Muhammad: Hello, everyone. My name is Muhammad Haris Rais. I am a PhD student at the Computer Science department at Virginia Commonwealth University. And my group is the Security & Forensics Engineering Lab headed by Dr. Irfan Ahmed. And today I am presenting a methodology to analyze the memory of a programmable logic controller.
So in the last talk, there was a talk about acquiring the memory through a network, and in a previous work what I did was acquiring the memory through some hardware interfaces. But a part of it was how to analyze that memory. So this work would generally talk about how to do the analysis of the memory.
The PLCs are at the heart of the industrial control systems and the memory forensics of PLCs have a lot of challenges. One is there are no acquisition tools. The other thing is, even if we have the memory dump available, this brown field deployment from the last 30, 40 years, there are dozens of vendors and they have their own proprietary architectures providing firmware and control software.
So even if we do a traditional approach of reverse-engineering the control software or the firmware to find out different memory artifacts and different definitions, it’s not as scalable and is tedious.
So we are proposing a methodology to create the memory profile through application layer interactions, and these application layer interactions usually don’t change. Why? Because PLCs are supposed to control physical processes and those physical processes don’t change even if the PLC vendor changes. So that was the theme of our study.
And we did our study on Allen Bradley ControlLogix 1756-L61 controller. So Allen Bradley is a famous brand in PLC, and this is one of their larger versions of PCR, a module at PLC. And we consider this work to be a step forward towards a generic framework where we can conduct the memory forensic analysis for any PLC.
Now, there is one limitation in our work is that like we do require, we cannot use a suspected PLC to create a memory profile. So we do require a test PLC of similar model and an acquisition capability to acquire the memory from that test PLC and analyze it, reprogram the PLC, acquire the memory, reprogram the PLC, and then through this loop we will generate a memory profile for a particular PLC.
So as I said, programmable logic controllers, they have a lot of proprietary of hardware and controlled software, but the architecture is usually similar and the function is also similar. So this is how a PLC, a functional diagram would look like; we have a hardware layer that is controlled through a firmware, and then on top of that is an application, usually it is found in the CS control logic.
And this hardware has input modules that are connected to sensors from any physical process and then output modules that are connected to actuators. So this is generally how a PLC looks like. And in our case, we have ControlLogix 1756. So this is how it looks, like it’s a modular chassis with a controller which is the brain of the chassis.
And then we have a different variety of input and output digital and analog input output modules, then counters because timing is very important, PLC there are dedicated counters. Communication, like internet communications or other communication modules, and then the power supply unit.
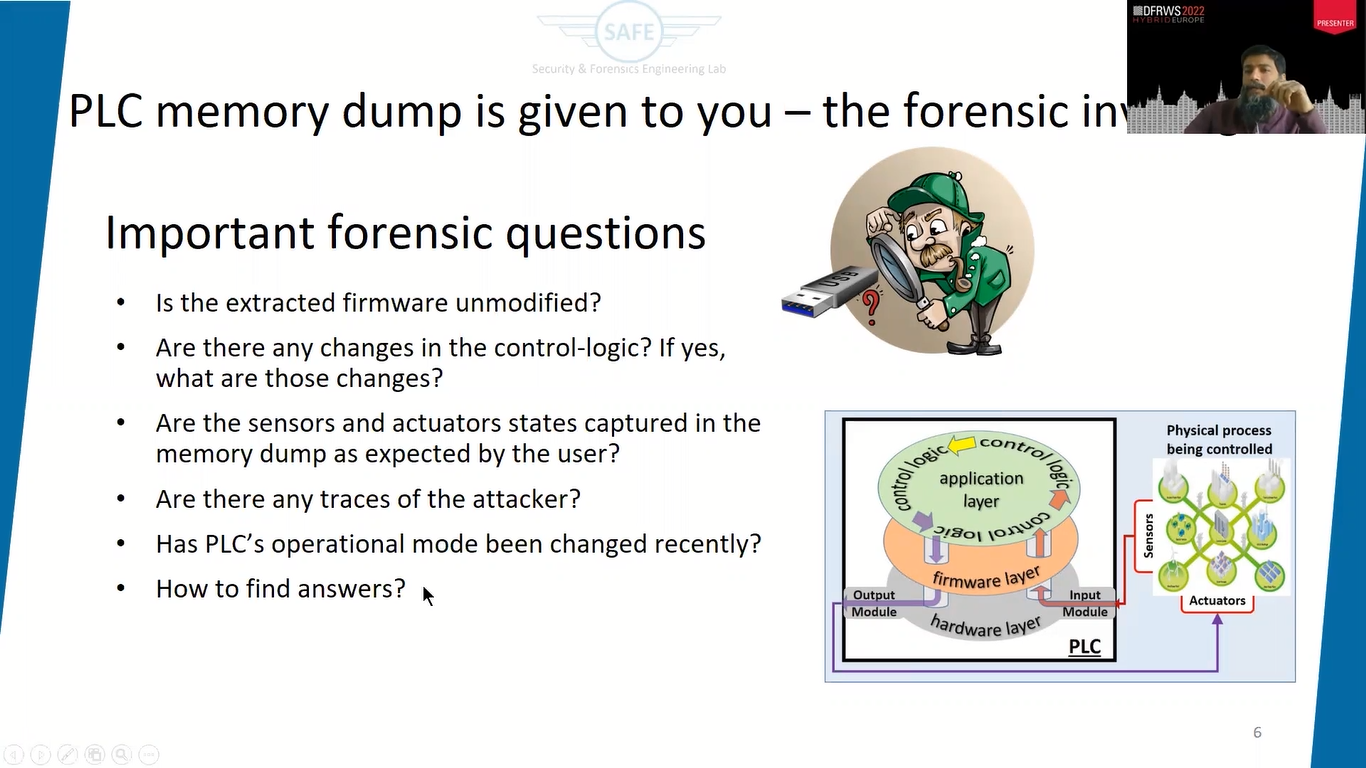
Now, let’s suppose that you are the forensic investigator, and you are given a PLC memory dump to do the analysis, and there is no memory profile available that you can pass and just find out different forensic artifacts. So what would be the important forensic questions in this regard that you would like to get the answers of?
So I have come up with a few questions. For example, is the firmware modified or not modified in the memory dump, if you can find the firmware? Are there any changes in the control logic? So this is the control logic that actually actually steers the process or monitors and controls the process. So are there any changes in the control logic, which is available in this memory dump? If yes, what are those changes?
And again, the sensors and actuators, what is their state? The state of the output pins, the state of the input pins in the memory dump? If you are able to acquire the state, are they as per the expectation of the user, or are there some anomalies in those?
And then the famous thing, are there any traces of an attacker? If somebody attacked, can we find some traces in the memory dump? And so PLCs are controlled, when we program the PLC, we put it in program mode or there are some other modes like test mode and run mode. So was there any change of mode?
Because if some attacker wanted to change the program that is running on the PLC it would’ve changed it to the program or some other mode. So can we find some history of mode changes in the PLC? So these are some important questions that we would like to know in the memory dump.
So how to find the answers. So what approach is just to, as I said, like reverse-engineer the firmware, get the firmware from the website and the control software and reverse-engineering, but that I said is too tedious and a lot of manual effort would be involved and it’s not as scalable, as well.
So, we propose an application layer, interaction-based approach. And in which the first step is we do the control software analysis, we explore the control software. And the control software is a software that actually where we can program the PLC, push the program to the PLC and get some feedback that we kind of monitoring the PLC, as well.
After exploring the control software, what we do, we create a test case, sequence of test cases, and then push one by one, those test cases and then acquire the memory. So push a test case, acquire a memory and analyze the dump.
So that’s kind of a loop that we do, but we also identify if the data structure definitions are available. For example, if you are lucky that in most cases you won’t be. Like, there is a source code available, or the vendor is already providing some documentation about the data structure definitions.
So you have debug symbols, and through some documentation, we are able to find the data structured definitions. If not, what we do, we do the analysis. As I said, like, acquire the memory, do the analysis, find the data structure instances.
And after that, once some instances are available, you try to refine those instances and apply some heuristics, carving, and list-walking based rules to identify the data structured definitions, and then verify those definitions, and then finally create a profile.
In our case, we created a profile as a Python library and from that profile can be used readily for any next memory dump for the same PLC and readily extract all these kind of artifacts that we are talking about.
So exploring the control software, what we do with that, there are two purposes of exploring the control software. The first is to recognize the forensically product data. As I said, like different vendors have different kinds of organization of the PLC projects and different logging information, configuration data, all these things can be different in different vendors’ PLCs.
So you just take a look at the user, like, what all different kinds of information that are available to be programmed for that particular PLC. And that gives an idea like what we can expect when we see a memory dump. And this study also helps because if we have to program the PLC and read the memory so that it helps in the configuration process, as well.
The aspect that we should look for is the project organization. So the project is something that I said, like we say it’s ControlLogix, how it is organized in this particular PLC. Find out that organization, then see if we have some kind of named structures available, because we have no information about how the memory is organized.
So if these named structures are available and we name them ourselves, and we find them in memory, if we find them in memory, we will be able to create some kind of linkage.
Then there are some unique data patterns. So there are a group of patterns, and then you can also define some logical variables, or you can score logical tags. So these tags, physical or logical, we can define different kinds of patterns like 1 0, 1, 0, or whatever, and then search for those patterns in the memory dump to find out where those particular structures are most likely to be residing.
So this is creating an expectation. Like, what all we are going to see in the memory tab. Then PLC configuration data, that’s also important. We will take a look at it in the next slides.
So the project is organized in this particular case, Allen Bradley, as in the form of tasks. There are like 32 tasks in one project and each task has up to 100 programs, and each program has multiple routines, and each routine a lot of rungs and each rung has inserted into it like a five-layer hierarchy that’s available; and we can name except for these rungs and instructions, but we can name the routines, the programs and the task, which is a good thing.
So what we do, we create a program here in RSLogix 5000, that’s the engineering software or the control software for this particular PLC and push it or download it in the PLC.
So this is a snapshot. You see that the main task within this, the main program and within the program, there are a lot of routines. And you can see, like, I have named some of the routines as per evaluation to see them in the memory dump.
Another important thing is the program tags. So these are the tags that can be used as logical input and logical output, just as we use in software programming some local variables kind of stuff.
As I said, like RSLogix 5000 allows us to name tasks, programs, or routine or logical outputs; and these names are also transferred to the PLC. So I realize some of the descriptors are not pushed to the PLC and some are, so these names are pushed to the PLC as well and we can see them in them and read them.
Unique data patterns, as I said, like IO input and output pins, we can configure and find out some kind of pattern that is easy to find out. Like, for example, in this particular case, I like set deliberately an ABABx pattern. And I know that these patterns, if it’s recurring, it’s easy to extract out or search in the memory dump.
This is how the control logic program looks like. If you see there are two routines here and within a routine, like, in this particular routine has two rungs; rung zero and rung one. And this routine has only one rung. And within a runf, there are instructions.
So this is one of the instructions, it’s the instruction, and over that instruction is a pin that is attached, like the input pin. And this input pin, the name of this input pin is TAG_1_CONT.14. So this 14th pin of some tag, some logical tag that I have defined myself, and that input is supplied here.
And this is how the control logic flow looks like. These are called branches. So it’s branching and different kinds of like, open and closed gates and some other timers, et cetera. So that’s how the control logic looks like in the RSLogix 5000 software.
The next thing is the configuration data. So we also want to see like, what all different type of services we can program in the PLC. Like, are there some ports on which PLC is listening? What are the network addresses? Like for example, IP addresses, Inventory available, what kind of logging information we are getting from the memory. So that’s very important.
So as a matter of fact, there are no formal logs available in the RSLogix 5000, right? I inquired the vendor as well about some logging information, but unfortunately not much is available. But this information, whatever is available, it helps in creating an expectation. So you can see here, I mean, it’s saying like, this is the IP address of a particular PLC that is attached to this particular software.
And important, so although logging information is not available, but it does tell the memory utilization, which is important. And there are two types of memory. One is dedicated for IO and the other is dedicated for the data and logic. So it does tell us like the IO is around 500KB and the logic is around 2MB and it tells us like, how much is currently utilized. So that’s available in that control software.
And it also tells us like some kind of setting about, so it has a SD card as well, which is another important forensic artifact, but that’s not our mandate right now. But it does tell us like if there is a restart, should it fetch the project from the SD card or not, or only in the case of corrupt memory instances, or user initiated? These are different kinds of modes for triggering the backup that is available in the SD card.
It also tells us about the information of the current user. So that’s not the RSLogic software, this one, but it’s part of the same suite. It’s called Factory Talk. It’s kind of the licensing server, but it tells us which username and the machine is logged into a particular PLC.
So this is the hardware-based setup for acquisition of memory that we just reused from our previous work. So this is the control PC through the ethernet program and through a Jtech debugger, we flashed the memory.
Now, the next step is how to come up with the test cases, like, what type of test cases we should do? So, I realize that I linked the test cases with the forensic questions that we want to get the answers for. And so these test cases are such that we should find out, one is we are interested in finding out the firmware, the other, the task cases should be that we get the named structures. So take the name, each named structure, modify those names and identify their location.
Similarly, control logic, we start with a very basic program, and that can tell only one rung, one instruction, one input. And then we keep increasing the complexity atomically and analyze, like, what are the changes in the memory going on?
Same with the IO data, as I said, like, we identified some kind of patterns in the IO pins and then try to find out. Similarly, in the configuration data, we try to find like if we change the modes, what’s happening; if we change the IP address, what’s happening; and try to find out these locations.
So named data structures. I realize like there can be three kinds of named data structures that are available in the memory. The first is the data structure or the string. The name, the string is a complete data structure in itself. Or the string is part of a bigger data structure. And the third one is a string as part of an especially staggered linked data structure.
That’s the most complex thing. Like, it’s part of some data structure that is not residing in one location and it has some different staggered locations and they combine to create one type of data structure. Like, for example, the PLC name, the controller name, it’s a complete data structure you can find wherever you will find the controller name. You can set the controller name and you can search it out and that’s done. Job done. That’s easy.
And the time zone is a bigger data structure. So when you find a time zone, you definitely expect the time zone value as well and some other metadata attached to that instinct. So there would be a bigger data structure, and it would be so, this is strength, whatever the time zone is would be part of that particular data structure.
But for the linked data structure, what I did was I applied some boundary markers. So I tried to find out the particular string that I said in the vicinity, what kind of boundary markers are available that can qualify some for some boundary markers? And then within those boundaries, are there some forward and backward lengths available?
So forward link is simple and we can find out like, where are the some memory addresses that are available within this vicinity, and for the backward length, what we did, within the memory dump we tried to find out that particular instance where we are right now, where that string is available and that particular instance wherever they are called.
So that’s how we tried to create a link between power and backward pointers to find out the link data structure or a free type of data structure.
We were able to like find out around 22 structures within the memory. Some of them I will just discuss here. So the fastest assignment, I mean, these names are arbitrary. I have just given these names.
So the first one, the data gave us assignment data structure. This is in my opinion, is the mother data structure for all. Like, every type of task, every type of new structure data is being defined. It would have one assignment data structure. It has this kind of marker like 80 00 00 0A and the ending marker is the same.
And it has 10 D words, always. And there are some kind of some 10 fields you can say within those, not 10, eight, rather, the first and the last D words are always these, which are the markers of the data structure.
Then there is a tagged description data structure. So you remember the tag or the name that we could assign. So anything we could assign a name, that would have a tagged description data structure. And this tagged description data, its marker is like 80 00 00.
So xx and yy is the next D word. The first D word would be xx and the last D word would also be this. And xx defines the length of D words. So as we know, that name can have variable characters. So this is obviously the last one, the last byte is flexible. And the second byte is starting is also flexible.
I will tell you why. So yeah, but this is the named data structure, but its link would still be available somewhere here in the assignment data structure.
Similarly program, you recall the program is one of the hierarchy of the logic and this programmed data structure, it’s a big data structure, like 88 dwords. And there are some interesting fields from forensic perspectives and we only explore those.
But obviously it also has one assignment data structure for it. Then a routine data structure. This is a control logic data structure. That is an interesting data structure that we are interested in. And it is again a nested structure that is available. We will discuss it one by one.
Then, as I said, like run branching instruction and memory block data structure. So this is also interesting data structure that was available in memory that tells us exactly how much memory is utilized. So the control software probably just reflects, maybe it’s just extracting these values and reflecting in the control software.
So if we find these definitions, are we good with just carving these definitions and finding out the data structure instances? Most cases, yes, but may not be always, because as we know the drawbacks of carving. I also witnessed some of the control logic that was not being used was still residing in the memory.
So it’s a good and a bad thing both. Like, we would still like to have that thing, so you carve as well, but you cannot rely and say that this is the control logic that is exactly being run, then the memory dump was taken. So it may not reflect the latest state.
So these are some of the connecting graphs. Like, if you see this is assignment data structure. It has a pointer for the next assignment data structure. So it’s a linked list type of assignment data structures, a linked list type of data structure. It contains next assignment data structure, comes from firmware pointer where that has to be executed, and then the tag value.
So for the IO pin, what is the value of that? So that’s the important stuff. Like, what is the value of the IO pin. And description. What if you recall, we can give a name to any tag. So what is the name that is given to tag? So the name only, we just string searched, but that doesn’t help a lot. So we have to somehow find out this thing and find out this thing, and then we will be able to come up with an IO value that is available in the memory dump.
So this is the link list for that assignment data structure. This is the tag description data structure which says like the first D word is 80 00 00 04, but say like the four D word would be there. And within the first D word, the first byte represents the number of characters because they can not be like divisible by the D word of four. And if it’s not divisible, there will be some padding to make it to the boundary of the D word. And then the last D word is the ending marker.
This is even a higher tier of data structure in the memory. If you see, it also starts with assignment data structure, then we have this one is a link list nexus structure. This is the routine DT, and within the routine DT, we get a pointer for the routine logic. That’s the executable port that actually runs on the PLC.
From there we were able to extract the firmware. We got the firmware from the vendor side, and we were able to extract two instances of the firmware in the memory. The first instance is at this location, the second one at this location. And firmware is also available in the SD card, but it has some padding, I don’t know, probably because of some format that it has.
Then coming over to memory utilization, do as I said, there are two memories and each memory has two blocks. So if you see data and logic memory, it has two blocks. This is block number one, this is block number two. The first block always starts as a fixed address. And you see it’s like 0008, all zeros. It’s a fixed address where the memory block would start and it floats for this block, so at the end.
And this is the ending address for the block one. Similarly for block two, the ending address is fixed, but the starting address would close. And if you see when you add it up, it exactly matches with what’s available in the control software. So if the user is expecting something else and the memory dub is saying something else, we know that there is some problem, same as the case with the other memory.
Now, coming over to control logic extraction. This is the example software, and this is the control logic memory dump area. And the color coding represents how we decipher this thing. But we wrote a tool and applied all those rules that we extracted. And we were able to come up with 100% exact information that’s available here and all the time.
So we were able to extract all binary instructions and all different types of instructions that we program in the memory dump. This is the output of the Python. I mean, obviously it’s not a very fancy looking output, but it represents all the routines, all the instructions that are available in the control logic.
This is one of the algorithms to identify how we are actually decoding, because if you recall the last instruction, it’s just a small piece of it. It doesn’t say like, it’s tag one, zero empty zero controller zero. It doesn’t speak of all this.
So there are some ways to decipher it as one program. So configuration data, we were able to find out the time zone, the IP address, the project name that is available right now in the memory dump, the revision number, even the SD card files, the SD load mode, like is this user-initiated on that mode.
And also an important thing, the desktop computer and the username that actually programmed the PLC last time. And if it changes, definitely then we can know there is a problem with the dump.
We were also able to extract some logs that were not available in the control software. So if you see these logs are telling us like the PLC mode was changed to run and test and to program. So if somebody changed the mode to program, then there is definitely something going on, unless it matches with the user and the user has it.
So these PLCs are usually in a bigger environment where it’s expected that SOPs are in place whenever there is some change in the program that goes on. So that’s logged. So it matches the log or it doesn’t match the log, then it shows us that there’s some anomaly.
Future work. So one challenge is the availability of the memory dump. So this memory dump from this PLC, we acquired in the last work, and today, it’s well presented another, which is interesting, I would like to apply this methodology on that dump that he acquired. So we are also working to find out a few different other vendors and try to extract their memory through hardware-based methods.
And then we would like to create an automated memory profile generation tool. So, I mean, we said that this works for Allen Bradley 1756, and ideally the test cases that we generated, we did it manually. So ideally it would be something that unfortunately the PLCs don’t provide APIs, but it’s still like, it can be some semi-automatic way in which we can generate a tool and find out memory forensic artifacts from memory dump for generic PLCs.
To conclude, I mean, so as I said, like PLC is a lot of propriety hardware from their eventual applications, making reverse-engineering not a feasible and scalable option. So this methodology uses application layer interaction, which is always the same because physical processes are the same. And we present an analysis on this PLC and our code and some sample dumps, and even the project files of RSLogix are available on GitHub for interested users. Thank you very much.
Session Chair: Thank you very much, Haris Rais. So let’s see if we have some questions in the room. Yes, we have a question here infront.
Audience Member 1: Hello. That was an excellent, excellent presentation. Thank you very much for elaborating. I did have a question in regards to the ports for that 1756/L61 PLC. Could you speak a little bit more about the ports themselves, the default configuration of that PLC?
Muhammad: You mean the physical ports or the the port that it’s listening to?
Audience Member 1: Yes.
Muhammad: Okay. So let me go back. So I don’t exactly recall on which TCP port it’s listening. I’m sorry, I don’t recall. But it’s a standard port. Maybe some other guy might be knowing. It’s a standard port, which I don’t have in mind, exactly. So in memory dump, it did not give me enough information, frankly, in my particular case, but generally speaking that can help.
Because, if you recall, this is the controller and let me go back a little bit more, so in this particular case, regular case, it has a dedicated module. So these TCP connections were terminating in dedicated modules and were not part of the controller memory.
So it was a setback for me, but still, I mean, this is one of the biggest PLCs they have, but the smaller PLCs we expect that the communication stack would also be built on the same controller. And we can have the traces for the port, as well. So I don’t exactly recall what the port number that st.
Audience Member 1: Okay. Thank you.
Muhammad: But one more thing. So I was expecting if it’s listening on SMNP or a web server, it does have a web server by the way, but that’s also terminating on the communication. And it doesn’t have xeslog or SMNP.
Session Chair: Thank you. Thank you for the answer. I also have another question because during your presentation, you started by explaining that the PLC has a task list; there are programs and the programs have routines. And I was always thinking when there is an incident which involves an industrial control system. If we have a PC, I would use maybe volatility to analyze the RAM memory of the PC.
And in the end, I got the same feeling with your tool that you are analyzing the memory and you’re basically also giving us a volatility analysis of the memory. So what kind of scenario do you see if something happened in a factory that involved PLCs? Do you have a tool for people, do you keep data, or do you intend to keep a database to store all the profiles to share, to facilitate and maybe to support forensic analysis of a range of PLCs?
Muhammad: So yeah. I have shared this information on GitHub. It’s available.
Session Chair: Okay.
Muhammad: And as we go along for other PLCs, we will keep sharing it on the repository. But volatility, I mean, it doesn’t have any plugin for PLCs. So this is the memory that is expected from PLC and yeah, volatility, maybe. I mean, once we come up with some generic profile, we are able to add some…
Session Chair: That was just an analogy. And the other question would be, looking for hidden programs or hidden tests, do you see that capability within the PLC or this particular PLC that it would be able to hide programs that are typically not seen? So like, PLC malware that hides from the normal operator view of the PLC?
Muhammad: Oh, so I’m not sure about it if it has that capability, but in the last paper, I mean, we saw that they did write some code and did do some modification. Even if they modified some control logic and extract it back, I think control software would still know if there is some change that has happened.
But if some user changes it and rechanges it, and you get a memory dump available, so memory dump would give you information exactly what’s there that has happened.
Session Chair: Okay. Any questions from the chats? Any more questions maybe in the room? Then I think that’s a nice time to end. Thank you again for your presentation.