Hi, I’m Cuneyt Gurcan Akcora, and I’ll be presenting our ransomware detection work on the Bitcoin blockchain by using topological data analysis. This is joint work with professors Gel and Kantarcioglu from the University of Texas at Dallas. I’m an Assistant Professor of Computer Science and Statistics at the University of Manitoba, Canada.
Ransomware is a type of malware that infects a victim’s data and resources and demands a ransom. One day you arrive at work or you turn on your personal PC and you see the screen that says, “You need to send some bitcoins to an address by some date. Otherwise you will never be able to recover your files.”
In two main types, ransomware can lock access to resources or encrypt your data content. After the ransom payment and decryption tool is delivered to the victim, in some cases, the decryption tool does not work, so most victims lose their data, even though they paid for that.
And ransomware has been very successful. Since 2012, a lot of victims have paid large amounts of money, especially this year, financial institutions, municipalities and hospitals have been hit with ransomware. This is due to three reasons:
- First, the cryptographic techniques that the ransomware is using are now freely available in many libraries in many programming languages.
- Second, we have designed privacy protocols such as Tor to communicate anonymously.
- And the third aspect is the cryptocurrency one. Cryptocurrencies such as bitcoin allow unlimited payments by exchanging short strings of addresses.
So these factors, when combined, provide a very high level of impunity for ransomware attackers. And the news is worse than you imagine. For example, only 3% of the victims of the ransomed people were conjectured by Symantec and Dell to pay the ransom. But an academic survey found that almost 40% of the victims paid the ransom to recover their files.
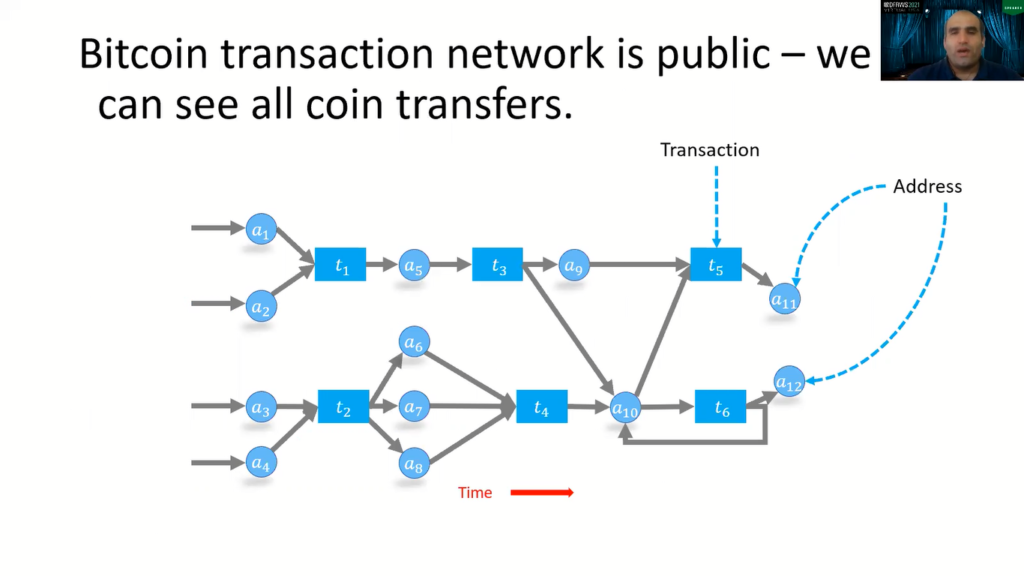
So, in this research work, our idea was to disclose these ransomware payments from the Bitcoin transaction network. As you may already know, every transaction on the Bitcoin transaction network is public. We can see all coin transfers.
If you are not familiar with the transaction network here, I’m showing you a toy network. The circles are addresses and the rectangles are the transactions. So, the directed address shows the payment of coins from one address to the transaction and then from the transaction to the address. And time flows from the left to the right. Here you will see these addresses given by the ‘a’ location, from a1 to a12. We have 12 addresses that create a network in six transactions.
All of this is public. Now, we have two research questions. The first one is, can we identify ransomware victims automatically on the transaction network? The second one is, can we discover the emergence of a new ransomware? Because these ransomwares become inactive, researchers develop ways to stop them, and new ransomware are developed all the time. And our goal, our two tasks are to accomplish these targets on the Bitcoin blockchain.
Now, how do we know which addresses to look for on the Bitcoin transaction network? The good news is that there are some known addresses for ransomware. For example, when companies are targeted, they share some ransom addresses with the law enforcement or with blockchain research companies. And some of these addresses have been leaked to either the public or published in research studies.
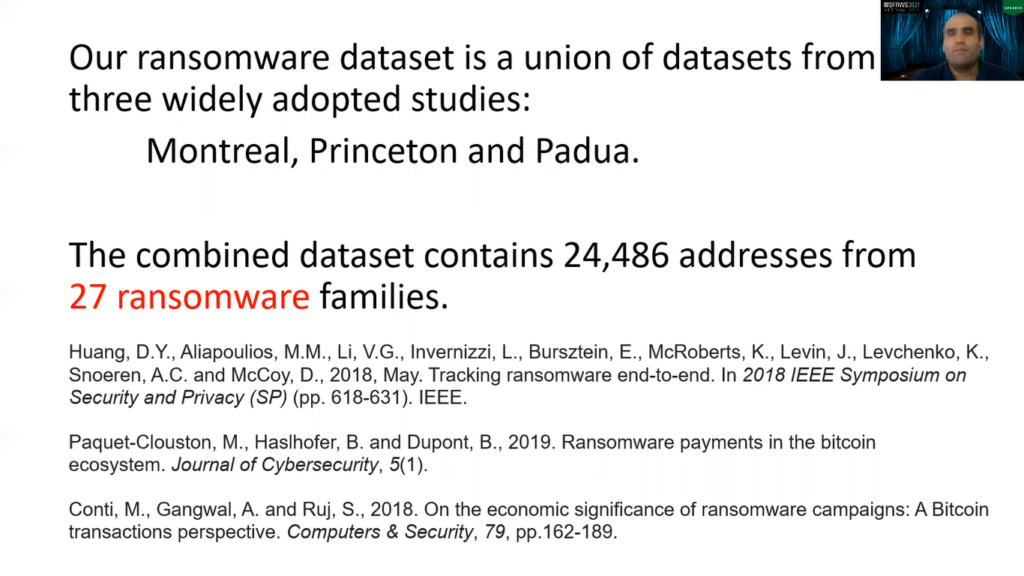
For example, here we aggregate almost 23,000 addresses from three academic works, and we can use these payments to these addresses and see if we can catch a pattern. And then from these patterns, we can find other undisclosed Bitcoin ransom papers.
In order to do this, we divide the Bitcoin network into 24 hours and the address can appear multiple times. In that case, we give a new location. We say the address ‘Au’ appears at time ‘t’. Now, we will have a set of addresses and each address we’ll have some features and a label. The label will be white if the address is not known to be ransomware, or the label will be a ransomware family if we know that address.
And if we let the labels of known ransomware families that are observed until time ‘t’ we give the label ‘F0’ to the addresses which are not known to belong to any ransomware family. In a sense, we have the ransomware family addresses and all the other addresses are considered white addresses. This is our assumption, which may not be true.
On the Bitcoin network that we call heterogeneous, because we have the address node and the transaction node, in each 24-hour snapshot we take the network of that day and we extract six features of each address. Six features kind of encode the behavior of the address on the transaction network.
The first feature is the income of the address. That is how many coins it receives in that 24 hours. The neighbors is how many transactions sent money to that address. And these were the two addresses.
The next four addresses are actually encoded with some features that start from what we call ‘starter’ transactions. For each window, we first locate the set of transactions that do not receive outputs from any earlier transaction within the study team.
So these starter transactions are kind of the first transactions of the day. And for simplicity, we will refer to such transactions as ‘starter’ transactions and then accept the next four features, depending on the position of the address to this set of starter transactions.
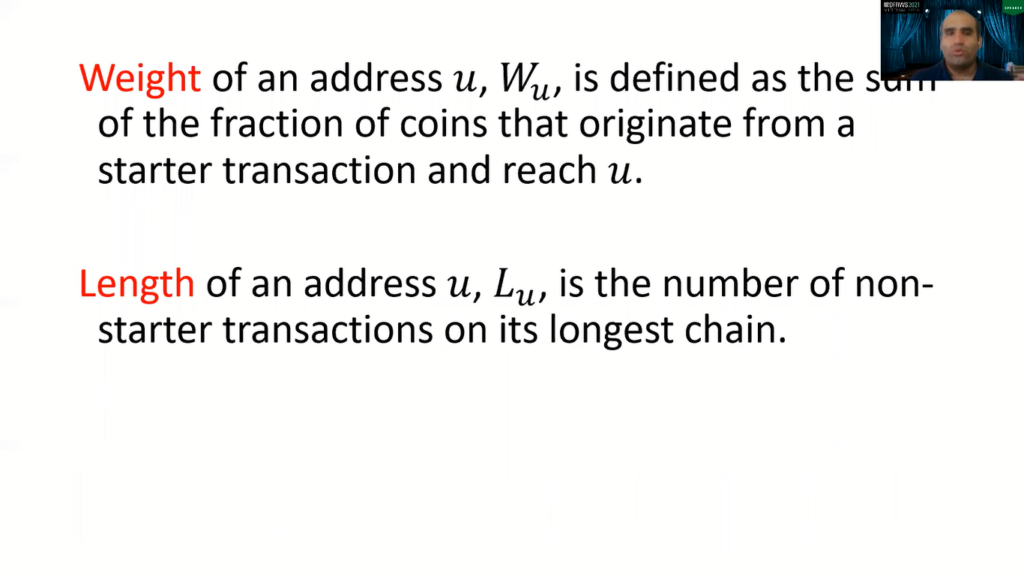
For example, the weight is defined as the sum of the fraction of coins that originate from a starter transaction and reach the address. Length of an address is the number of non-starter transactions on its longest chain. A length of zero, for example, implies that the address is an output address of a starter transaction.
So the starter transactions are kind of the anchor points of their tape. The count loop gives the number of starter transactions that are connected to that, or the number of starter transactions that are connected to the address with more than one path, because there may be multiple paths that reach that.
Now, if we put all of these features together, we basically have a D x l-matrix of features and their labels. And our goal is basically to convert it to a node classification problem on the network with back tests.
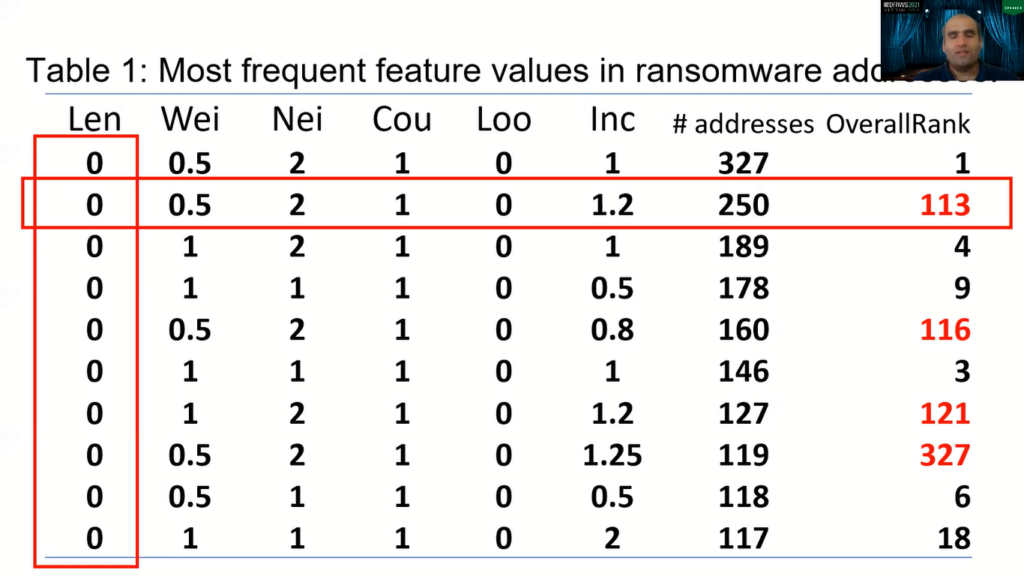
So let’s look at the address features of all the addresses. So here in this table, I’m showing six address features: length, weight, neighbor, count, loop and income, and here we have the number of addresses. For example, the top feature appears in 327 ransomware addresses and on the right, we show the overall rank of that feature among all addresses.
As you can see, this address that is very common in ransomware is also very common on all the Bitcoin transaction networks. So in essence, it’s not really useful. If you look at the second address, however, you will see that the second most popular feature pattern for the ransomware is not so common in all transaction networks.
So these are the patterns that we can use to identify which payments may be undisclosed ransomware payments. So, you will ask, why undisclosed? Undisclosed, because some companies don’t want others to know that they have been ransomed, because it indicates that their technical, for example, staff failed to keep them secure. So they don’t disclose these payments. So these are the specific undisclosed payments that we are after.
So, some of the features are interesting, for example, as you can see, most of the ransomware addresses have a length zero. That means they are the first transactions of that day. Like, they are the outputs of the starter transaction. When we look at the patterns, we see interesting things.
For example, we see that almost all of the ransomware payments are N-1 or N-2 payments. That means in the payment, there is direct payment, all of the coins go to the ransom address, or sometimes there’s a second address that receives the payment because it is like the change that is left over from the ransom amount. If you look at these features, the first question we can ask, well, if we know that some features are very popular, can we go and search for these features on the Bitcoin transaction network?
We did that, and surprisingly, we caught too many true positives with this, which is nice. So in this figure, for example, the blue dots are the number of ransom addresses that we find by using just simple pattern searching in a back-testing framework.
So, the problem with that is that we also have too many false positives. In general, we created, for example, 20,000 false positive addresses. If you are an analyst, you are trying to manually look at addresses, if it’s a ransomware or not. If you give it 20,000 addresses, we’ll say, all of them are suspicious, then it does not really help you because you need to go and check these 20,000 addresses manually.
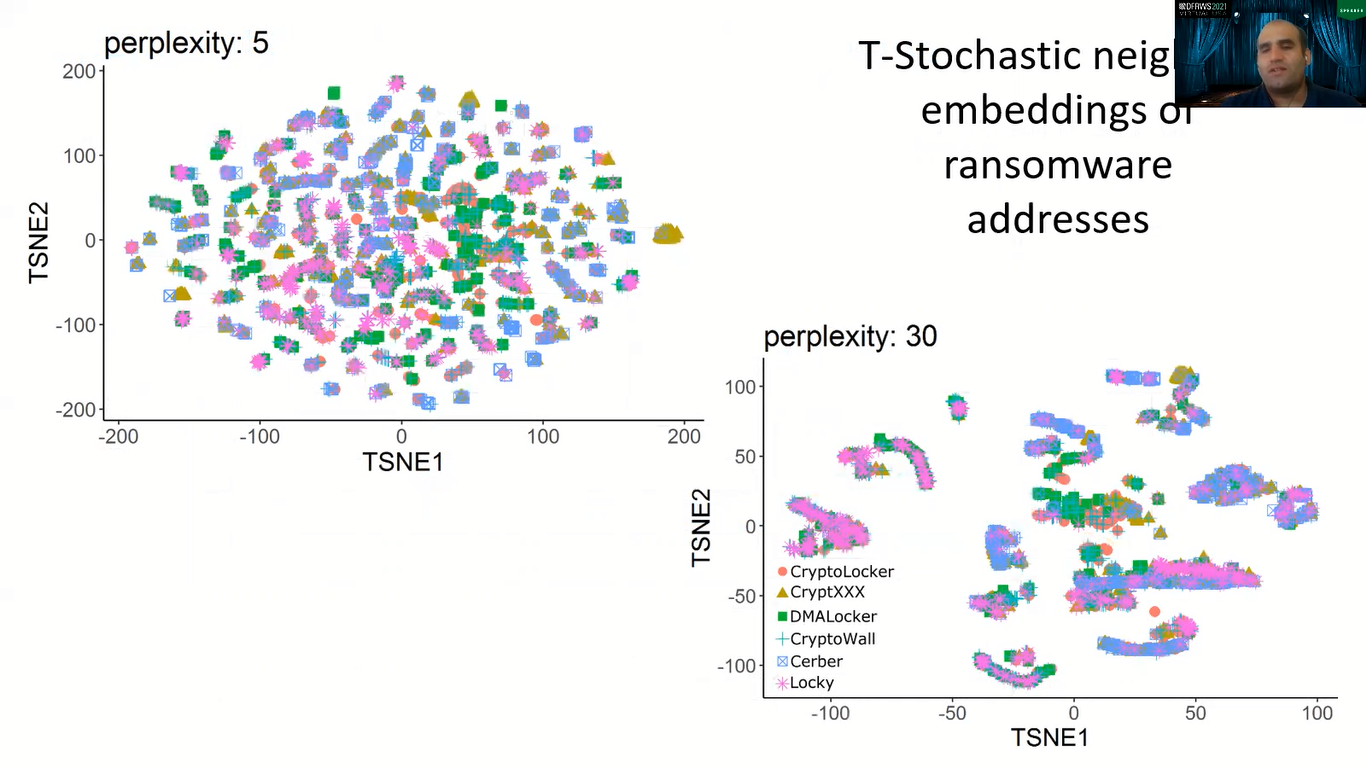
So the next question is, are the operators of these ransomware families, for example, CryptoLocker, CryptXXX, there are these names in the bottom figure, do they behave the same? Do addresses of these ransomware show the same pattern over time?

Here, I am showing you the T-stochastic neighbor embedding of these ransomware addresses. And as you can see, for different perplexity, we don’t have any global patterns. Here on the top left, you will see the cryptics family here, showing a kind of set of addresses that showed the same pattern. But in general, we cannot talk of a global pattern. So, the behavior is diverse, which is bad news if you are trying to detect, because that means there is no one-catch-all rule here.
Now, what we did is we applied topological data analysis from this on this data. And here I’m showing you the resulting network, which is very sparse. The numbers within the clusters show how many past known ransomware addresses exist in that cluster, and within the cluster number is how many addresses appear there.
So, we apply four methods from the literature, because our problem can be considered as network node classification with past data. And there’s a fifth method: we apply a TDA Mapper, and I will give you the results of this.
So the key idea behind Mapper is the following: we let U be a total number of observed addresses, and we have a data cloud of address features. We use a filter function, and we let I be the range of Epsilon in a way that we define a filtration from the minimum to the maximum of that feature.
And from here, we place the data into overlapping beams. This is kind of like overlapping clustering in two or three dimensions. In each cluster, you have past old ransomware addresses and the addresses of today, let’s say, if you are in a back-testing environment, and you see if the address of today appears in the same cluster with known past ransomware, the address is suspicious.
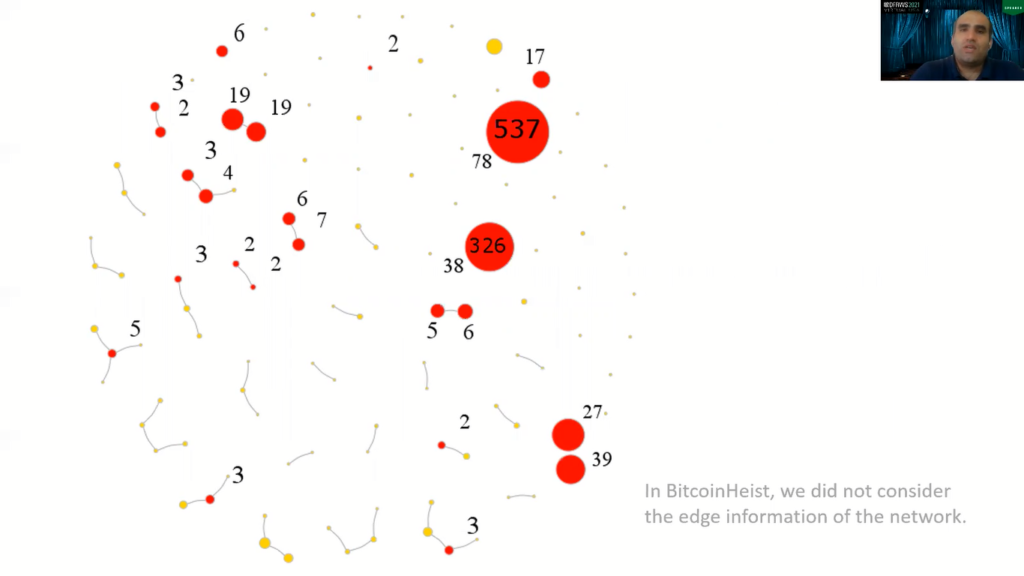
So in a sense, we are applying this suspicious case and we say, “Well, this address appears in a cluster that contains too many past ransomware, so that address is suspicious.” For example, here, I’m showing you 537 addresses and 78 of them are known past transfer addresses. And you may say 500 is too many and only 78 of them are ransomware addresses. So, should you really give a suspicion score to the rest of the addresses?
So if current addresses are contained in clusters that also contain many past ransomware addresses, by association we deem these kinds of addresses potential ransomware addresses. And we filter the TDA Mapper graph by using each of our six graph features. As a result, we get six filtered graphs, and afterwards we assign a suspicion, or risk score to an address.
Here I’m showing you the results for the first experiment of detecting undisclosed payments. TDA gives the best F1 score. For each ransomware family, we predict 17 false positives for each true positive. And in turn this number is 27 for the best non-TDA models.
In this table, on the left column you will see the ransom family and the two best performing methods. And I give the true positive, false positive all the numbers. You will notice that the recall is very high. In a sense, we catch all the known ransomware addresses, but the precision is very low. In the paper we also have future experiments that show, kind of, not show, but give the statistical confidence results that these found addresses that appear as false positives may in fact be ransomware addresses that have not been disclosed.
So, in the second experiment, we tried to predict a new family. And the interesting thing is that we are actually very successful. Here, for example, for CryptXXX, we detect two addresses for the day when CryptXXX first appears, and one of them is in fact a true positive address. In general, in locating ransomware addresses, we predict 17 false positive ransomware addresses for each group posted, and in identifying new ransomware families, we predict 27.53 false positive ransomware addresses. And these are found among 600,000 Bitcoin addresses daily.
We have released our data set on the UCI Machine Learning Repository with clean temporal data. And for more, please email me at [email protected]. Thank you for listening.