Steve: Good afternoon, everyone, and welcome to our “Network Capture Using Binalyze AIR” workshop. We have two people on the call today, so we have Emre who I guess you’re all pretty familiar with, who’s the founder and CEO of Binalyze. But we’re also joined today by Erhan, who is the product owner of Binalyze AIR here at Binalyze. So he’ll also be assisting Emre with the workshop and the demonstration of the network capture feature. You’ll probably be pleased to hear I will not be participating too much in this one, but I am here to do the housekeeping. So as usual, if you have questions (please have questions) or comments, you can use the panel on the right-hand side to submit those, and we’ll deal with those questions at the end. We also have a discord server for more technical discussion, and I encourage you to join that when you get a chance: I will paste the link to the discord server in the chat in a few seconds time. And if you’re an existing user, as always, of Binalyze products technical support can be accessed in three principal ways: first of all, on the website by binalyze.com/support, or by email [email protected], or using our knowledge base, which is kb.binalyze.com. That out of the way I will hand you over now to Emre, he will introduce the network capture feature and then we will dive into the demonstration.
Emre: Thank you, Steve. Hello everyone. Thank you for joining today. Today we’ll be carving our new feature, a network capture, that lets you collect even more evidence on an incident response case. So before we start, let’s talk about what is the status quo in the DFIR. Normally when we have an alert or we have a suspicion in one of our endpoints, most of the time we do a full disk image or in some cases we can also take a memory image. And there are also, based on the surveys we have performed on our customers, some of our customers are also performing network capture, but they don’t prefer to because of the friction and the level of expertise required. And then you process this data and you analyze it. And then for having it for another endpoint, you go up to step one and repeat all these steps.
So the problem here is it’s not scalable. Because when the acquisition of full disk images were invented, which was the law enforcement, mainly, 40 years ago, we had disk sizes of a few hundred megabytes, not terabytes as of now. And so that’s why this approach is not scalable and it’s too slow, and most of the time due to the amount of data you collect, it’s too expensive. And another problem is, it’s highly fragmented because in order to merge the data that is acquired by this and RAM and network, it requires a lot of time to combine all that data into one single picture. And that’s why it doesn’t fit the purpose. So all in all, this approach…all these approaches are peripheral and they’re underutilized.
And because of this, we are moving into a cybersecurity based approach to a cyber resilience based approach. And I don’t know if you notice it, but five years ago, no one was talking about forensics, but nowadays we are hearing forensics everyday because on a day-to-day investigations in security operation centers, they are having more and more investigations that require us to have the ultimate visibility on the endpoint. So that’s why this is driving the development of a new category of cybersecurity solution that we call Enterprise Forensics. And we recently started to have some certifications provided by trusted companies. And even these certifications are in beta now, because we are in an industry that is evolving into an age that Enterprise Forensics is needed everyday.
Before we start with the network capture, let’s quickly compare the traditional forensics. As I mentioned previously, a method that was invented 40 years ago, mostly by the law enforcement for fighting against cyber crime, against the Enterprise Forensics, which is the modern way of doing forensics at scale. First one is, it’s slow; Enterprise Forensics is fast. You need to be physically available on the machine in traditional forensics, but in Enterprise Forensics case, you can perform everything remotely. And traditional forensics is reactive, Enterprise Forensics is proactive. You have integrated solutions in Enterprise Forensics, that way you get the most out of all the existing solutions in your environment by integrating with the Enterprise Forensics solutions, and it’s signal based, not like noise based in the traditional forensic case. And you can only perform it in working hours in the traditional forensic case, while Enterprise Forensics is always available 24/7. That’s why we see Enterprise Forensics as the tactical solution to deliver cyber resilience.

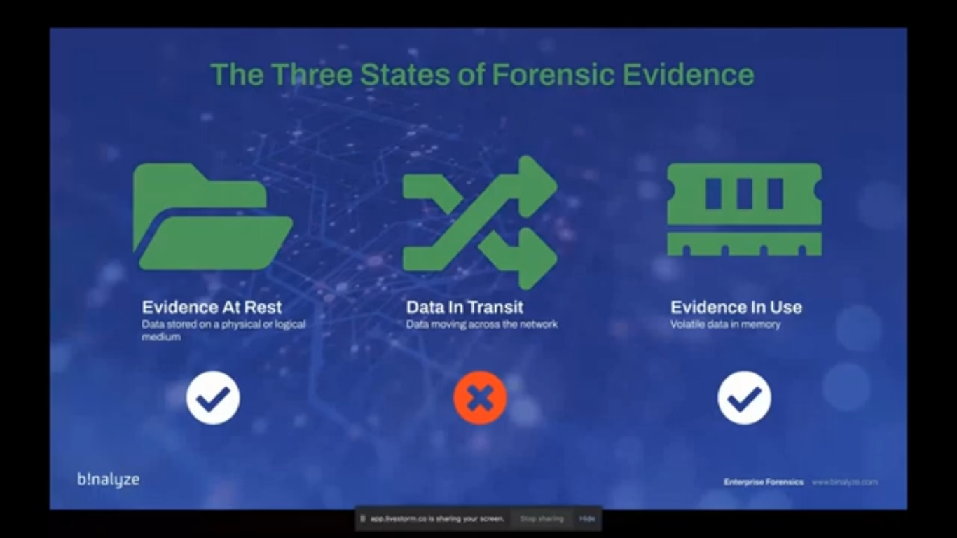
So before we start with the network capture, why we are adding this feature to Binalyze AIR? Actually there are three states of forensic evidence, and as of the latest version of AIR, we already covered the data at rest, and data in use, which is the volatile data (basically a RAM image) and data at rest is the data stored in the physical or logical medium, which is the volume of the endpoint. The only missing piece was data in transit. So that’s actually one of the reasons, but also based on the surveys we had from our customers, most of them wanted to have network capture, but just because there were not that many solutions that provide this out of box in an integrated way, they were having this lack of visibility. (Sorry, let me go back.)
So it’s already covered, I mean, evidence at rest and evidence in use is already covered. And now we are adding two new features in network capture. The first one is Network Flow, which has a brief summary of the connections made from the endpoint. And we also have a PCAP file that has the deep dive information about every single byte that was sent or received by the endpoint.
So what are the evidential benefits of this? First one: it lets you define attackers’ network communication methods. So this way it helps you catch them in preparation, phasing their attack. And it also provides additional visibility, because Binalyze AIR already captures huge amount of information from the endpoint. So when you have the case reports of Binalyze AIR, 99% of the time, you have everything required for starting an investigation and finishing an investigation, but there may be some cases where attackers are deleting the logs, or like, trying to hide their traces. Even if you delete some logs, every contact leaves a trace, so there will always be some traces on the endpoint. But having more visibility is always better. And this is one of the biggest advantages of having a PCAP file from the endpoint. And also when you have additional context, this way you can enrich the investigation, because you already have the current forensics snapshot of the endpoint, which is the current state of the endpoint. And if you have additional data, which is the PCAP or NetFlow in this case, you can further enrich the investigation. And that way you can have more clue on what happened on that endpoint.
The problem with forensic network capture, is most of the time companies or enterprises are using hardware based solutions for acquiring this data. And it’s just like having a hammer to crack a nut. Most of the time the Fargo solutions are providing this, but they are hardware based, and that’s why they are mostly in a central location and that’s why they create huge amount of data, because you’re not able to narrow down the acquisition to a single endpoint. Of course you can apply some filters and get the data you want, but still you need to depend on a hardware device most of the time. And it’s also fragmented, because it requires many other tools to complete the job. If you don’t have these type of hardware in your enterprise then based on the survey we had from our customers, what they’re doing is, they’re trying to deploy command line utilities on the endpoint, and that way they are running it by remote desktop, are dipping into the machine and then trying to get PCAP or running some command line utilities. And the biggest problem is these solutions, these platforms are mostly owned by the IT departments, not the security department. So when you’re facing the fire, when the clock is ticking, when you need this data, you need to get some access and you need to, I mean…there’s a lot of bureaucracy. So that’s why it’s creating a lot of friction on the way.
So our approach with Binalyze AIR, AIR is among the few products that combine this with the endpoint forensic data, and we call this integrated approach. And this way we provide a highly targeted and granular functionality. That way you can gather this information from a single endpoint, or you can also do it on a group of endpoints, or if you even go further and you can run it on whole network. So as long as you have sufficient space on the evidence suppository, there’s no limit. And it’s fully integrated, which is one of the unique features of AIR, because just like in all the acquisition profiles, when we talk about the network capture, it’s part of an acquisition profile. So…and as most of you already know, you can easily integrate AIR, or the existing SIEM store or EDR solutions. So whenever you have an alert from these products, you can easily capture evidence and start the network acquisition at the same time. So it’s fully integrated and automated. And just like all the other features of AIR, it’s remote, and it’s scalable and it’s collaborative. So you can capture from any endpoint instantly, and you do this using web-based AIR console. It’s also accessible and frictionless because whenever you need to capture network packets from an endpoint, you don’t need to ask any permission (of course, if you have enough privileges, because AIR comes with extensive user roles and privileges). So as long as the user of the platform has this privilege, they can easily perform this acquisition, with just a single click.
So what can we do with PCAP files? You can use them for extraction of files. You can inspect content, which can include addresses, passwords, and other information. You can also use it for early detection of attacker targets. And even though we provide two types of acquisition (network and network capture models), you can use PCAP for more visibility, and that way you can detect ICNP tunneling, SSH tunneling, DNS tunneling, and internal proxy detection. Or you can also use the NetFlow data that can be easily inspected, even using just a basic text editor or a Microsoft Excel.
And how to use PCAP files? You can easily use some open source utilities, or when talking about the network flow files (which is basically a CSV file) you can use it for enriching timelines. That is also, that is again, created by AIR. And once you extract some files from the PCAP files, you can easily run a triage on all your network by using the hash of the file, and you’ll already see, like the acquisition reports…because the network capture is part of an acquisition profile, so this way you see the acquisition of the endpoint and also the network capture. And there are also other free and commercial products that start with Wireshark, which is a free product that has a lot of features, and there’s a command line version of Tshark, or there are other common utilities like Tcpdump, you can use for creating…which is what most of our existing customers use right now. But again it comes with a lot of friction because you need to connect to the endpoint, run it, and then wait for it. And once you have the PCAP file, you need to transfer it into some remote location. And when talking about a potentially infected, potentially compromised machine, it becomes really hard, because even having access to that endpoint is a problem by itself. There are also other solutions like Network Miner, Security Onion and Brim, which is one of the tools we’ll use today.
And these are challenges of network capture. Some of these challenges also apply to our solution as well. When the network speed increases, you may have huge amounts of data. So that’s why having some predefined duration is important here, and encryption is the biggest challenge here. And even though the data is encrypted you still have a lot of useful information in the PCAP files. Still even when encrypted, you can use some signature based detection, and this can provide, like, quick alerts, and Snort and Suricata are examples of this. And again, one of the challenges we already mentioned, is network product is not always owned by the security teams, which is most of the time owned by the IT admins. And using AIR for network capture, especially for MSP teams, they can easily collect information, like data from network, without asking any permission or facing any friction.
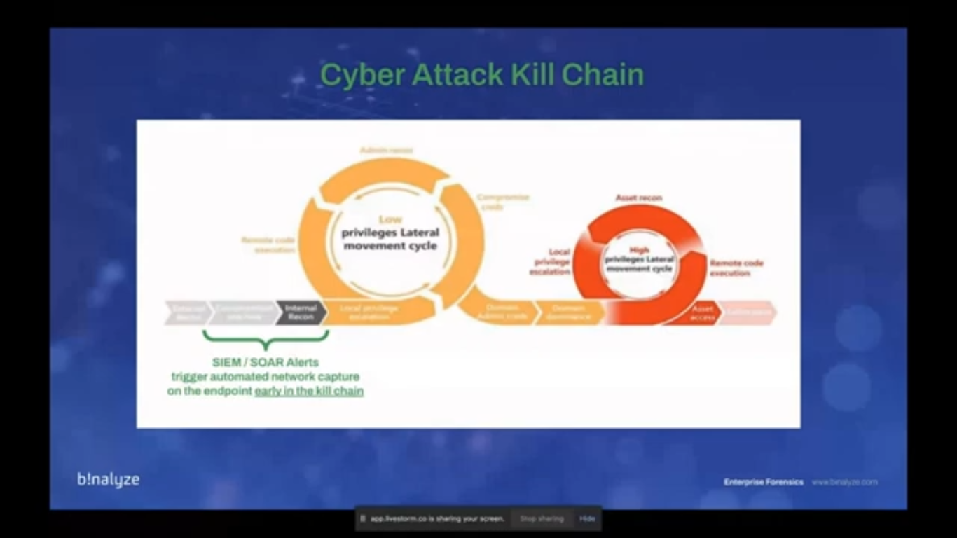
And this is why we call it aligned to attacker behavior. And the reason is, we already have a lot of products in our environments, and we already receive alerts from our SIEM, SOAR, EDRs, and these products are already raising the flag. The problem is, we don’t have enough people, in most of the cases, to respond to these alerts and start a recording of the endpoint – let’s call it that way. If you integrate AIR, you can easily trigger the automated network capture on the endpoint, and as you see this as the cyber attack kill chain, and this way, by integrating it with the already existing products, you can start this acquisition early in the kill chain, that provides you even more visibility combined with the acquisition reports.
All right, let’s investigate. Today, we have a very simple case that will quickly highlight what can be done with PCAP files and NetFlow data. This is a very basic scenario. And in this scenario, we receive an alert from our SIEM and we are using a widely used SIEM, and it’s called Offense. So the alert we receive is internal recon activity, which is basically someone trying to scan the ports of an endpoint for finding some like vulnerable application or some exploits. And the information we have is, the source IP is this one, and we have a destination IP. By quickly checking our inventory, we see that this machine (like the source IP) is a web server, and the other one is a computer that resides in our IT department and which is used by our domain admins. So it’s, by itself, quite suspicious because we are having a traffic from a web server to a critical asset. And by the way, in this version, that will be – sorry, next version, let’s say, because we already have it an RC in our environment, we have ultra asset tagging features, so while we were creating this case, I mean – when you see these types of IP addresses, the first thing you do is checking your inventory, just like we note here. The next version of AIR comes with this feature embedded. So whenever you see an IP address, whenever you see an endpoint, or whenever you search an endpoint in AIR console, it already comes embedded with the text. So that way you won’t be required to check your inventory, because it automatically tags the endpoints, that way you see that this is a web server, and this is a workstation.
So let me stop sharing, and then I’ll share my screen. Can you still see it? All right, it’s visible right?
Steve: No, Emre, we don’t see your screen.
Emre: Just a second. How about now?
Steve: Yep, now’s good.
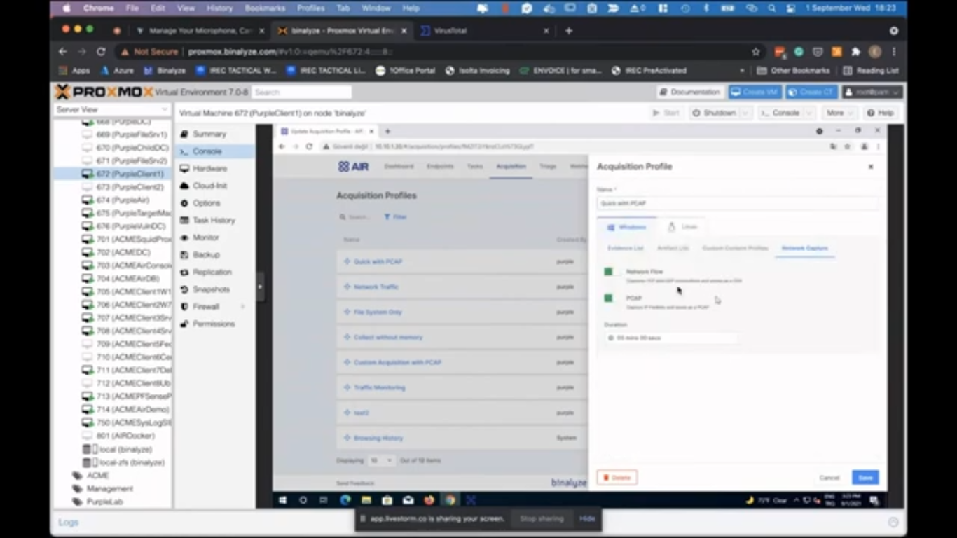
Emre: So before we take a look at the PCAP files and go into the details of how to analyze them, let’s see how AIR handles, like, takes the lead and collects a PCAP from the endpoint. So the feature we used here is the webhooks. Let’s see the previously created webhook here. If you click on it, you see that we have a already existing webhook, and we have an EDR configured here. (You can also easily like set it to some other SIEM solution.) And whenever this webhook is called by the product, I mean…AIR is not interested into the product, it doesn’t care which product calls it, in this case, we have QRadar as our SIEM solution. The first thing it does is acquiring evidence with the quick profile, with PCAP. Let’s quickly see what does it have here? Let’s go through the acquisition profiles and see what we have in this profile. So here we have all the system information, and then we have browsing history, master file table, SCSV (so if you’re not interested into the, like binary format). We have ShellBags and AppCompactCache, which can also provide highly useful information, because it will show us all the folders open in Explorer, and also AppCompactCache, which provides us evidence of execution on the endpoint. And then we have a network-related evidence here. And in the last section here, we have network capture. And as you see, whenever this webhook is triggered, by the SIEM or source solution – whatever the product is triggering or a solution here, you will be saving a network flow and then a PCAP file simultaneously, so these are taking place in parallel, and we have a five minutes duration. So whenever we receive this trigger, all the evidence listed here will be collected. And in parallel, we have a PCAP file, and a network flow file.
So we’ve already covered the acquisition. And also, AIR is receiving the trigger from the SIEM, but at the same time, we have this feature here. You’re also sending the information to the assist log server. In this case, we already received the award from our SIEM, but if you are monitoring all the actions from your SIEM product, you’ll also see that AIR takes the lead, and then acquires evidence and then starts an acquisition on the endpoint that also captures network data. So the communication is two ways: SIEM triggers us, and we do our job automatically regardless of the time of the day, and then we send a notification to the SIEM product so that your security operation center investigators can quickly see that we have an acquisition from an endpoint.
Whenever you receive this, whenever you want to start an acquisition, you can also create a timeline – let’s also create that one. So this is the machine we received the alert from, and you can easily click create timeline. And then you can also – in the next version, by the way (let me go back to the endpoint space so we have a better understanding of what happened here). As you see, we received a trigger and this was triggered by the SIEM, and even though we don’t have that feature now, in the upcoming version of AIR, which is 1.9, you also have an opportunity to send this acquisition into the timeline right away. But just because we don’t have it in this feature, what I’m going to do is, I will create a new timeline for this endpoint, and then let’s give it a unique name, and create. So we already have the acquisition automatically triggered, and we already have the PCAP file. So while it completes, let’s go to our acquisition and then see what we find in those PCAP files.
I already saved them here. Let me show you the format of that. (So let’s go to that cases.) And the acquisition location we used here is Binalyze…sorry, Binalyze AIR. That’s what we configured in the trigger. And here in this cases, if you click on one of them, you see a network capture here, and inside this we have CSV and PCAP files. So let’s go back and see these files on my machine.
Here we have a network capture folder, and then this is CSV and PCAP. One thing to note here, we already have an acquisition from the endpoint, as soon as the offense takes place on this endpoint, and we have, like five minutes of PCAP from the endpoint. And if you want to dig deeper, because if we understand that there is definitely a breach on this endpoint, there is a compromise on this endpoint, you may want to get the final state of that endpoint, and that’s why I have created a timeline on that endpoint. While it completes, we can also start the investigation of these files. Before we dig deeper, the first thing to note here is this is the NetFlow, and this is the PCAP file. So if you pay attention to the file sizes, the first one is like, smaller while the other one is around 10 times bigger. And the reason is this CSV file is a brief summary of which IP using which ports connected to which IP over which port. So let me quickly open it and we see the difference.
(All right. This is a text editor. Let’s open it in a more beautiful one. Okay.) So this is the NetFlow. They both have their weaknesses and strengths. I mean, if you like to have a quick look of what happened on that endpoint, NetFlow will most of them will be sufficient. And if you take a look at it, it has the timestamp, and we have the IP version, the protocol here, a source address, source port, and destination address and destination port. And this is the interface index that the connection took place on. So as you see, it’s brief, it only has the source port destination and like destination port, so even itself, I mean, even without having any payload of the connection, this file can provide useful as we’ll be using it for enriching the timeline. On the other hand, we have a PCAP file here, which is bigger, and which has more information. I’ll first open it with Brim which is one of our favorite tools here.
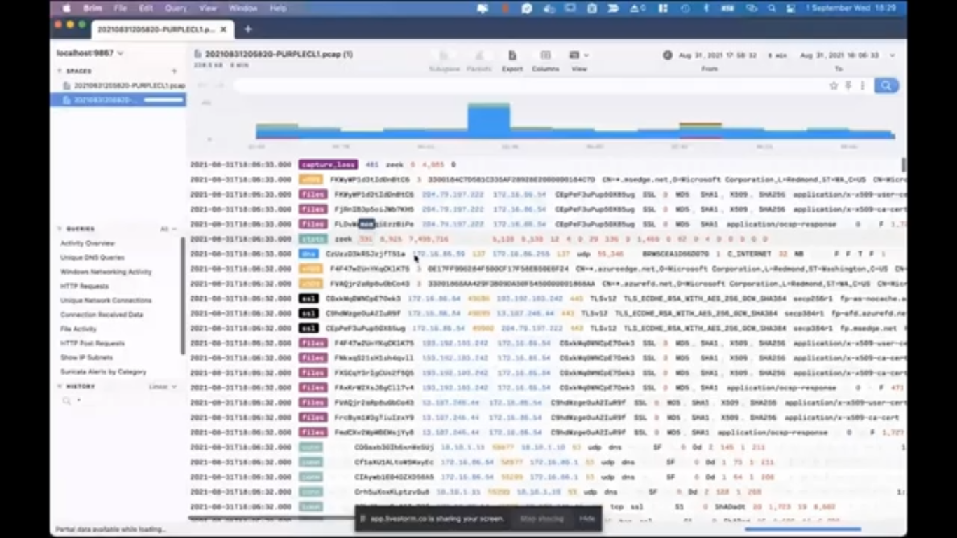
Brim is a free solution that you can use to have a summary of a PCAP file. It’s not as detailed as Wireshark, but still, it provides a lot of useful information. So if you want to have a summary, Brim is definitely the way to go. (Let’s drag and drop, and then maximize it.) So first Brim shows us a brief summary of what happened, as you see, like there are some like…the biggest amount of connections took place in these times. And we have activity overview here, let’s click here first. And then we see the total number of connections, and there are some DNS queries. The first thing I would do while investigating a PCAP is – especially in this type of a suspicious case, because we have received an alert that someone is trying to perform an internal reconnaissance by scanning ports. If you right click on it, and then pivot the logs, it shows you…sorry, let me go back and just double click.
(Pivot the logs. All right.) So on the right side, you see all the domains here, but compare it the unique network connections, this is…sorry, unique DNS queries. This is a bit, like comprehensive, but even taking a look at this information can quickly provide you some precursors. So as an example, if there are any randomly created domain names, you can easily spot that. And we also have HTP requests here, which is one of the things I like most. So if you take a look at it you’ll see the most recent ones. And one thing that attracts my attention here is the software_update.exe. So we’ll take a look at it afterwards. And there’s also HTTP post requests here on the yeah…here. So this is like, we see some of the AIR agent connections here, and this can be also useful because in case the attacker is trying to hide in plain sight, they will be posting their team to the HTTP servers, and you can easily find that here. Of course, if it’s not encrypted, if it’s not using SSL.
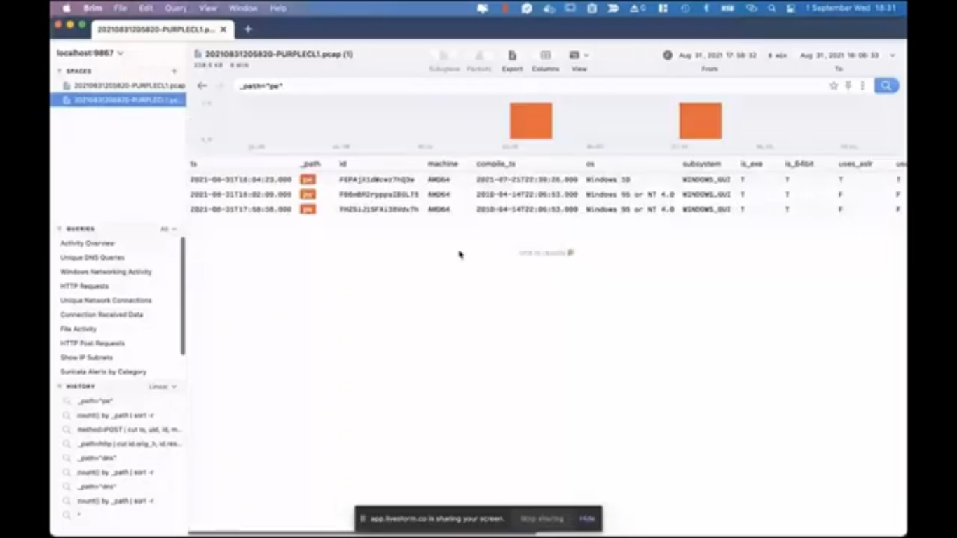
So let’s go to the activity overview again and scroll down. So there is something that’s interesting here, which is the PE files: PE is short for portable executable. So it means that inside this PCAP file, we have traces of an executable. And again, if you pivot the logs, you see that, like some information about those files, and the earliest one, which is this one, when you double click on it, you see some information about that portable executable file. And the first thing that attracts my attention as an analyst is the section names are, like this one, especially: .nkqj, it looks quite suspicious. And also there are some like uses_aslr, _dep, and these are all false, which is not something we see too often.
So all in all, Brim is quite useful for having these type of information as a summary. But when we start inspecting this file with Wireshark, we will have much more functionality, we’ll have much more visibility, but as I mentioned previously, it all comes with like, advantages and disadvantages. So having this information in Wireshark is a bit cumbersome, but again, it comes with great power.
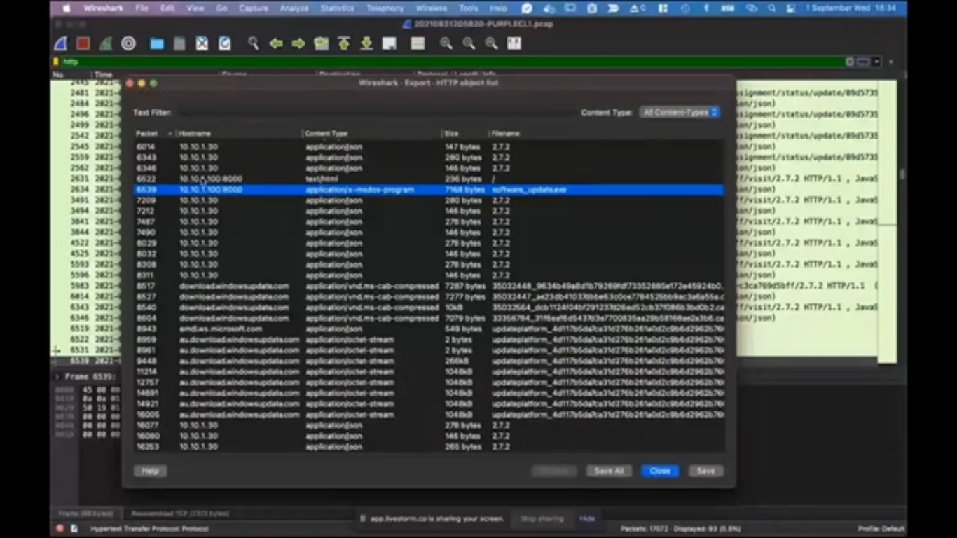
Let’s switch to Wireshark now. (I think it should be the default one. Let’s open it with Wireshark.) So I want to focus on that PE file, because that was one of the things that attracted my attention, and that’s one of the advantages of having a PCAP file: you can get the full data. So even if the file is deleted from the disk, even if the event logs were cleared, even if like, almost all the traces were deleted from the system you can still have the data of the, like packets, and that’s one of the best features. Let’s quickly filter the HTTP traffic here. And then you see, there are some like, normal HTML requests, some requests that are made by our agent, and then if you scroll down, you will see some software_update.exe that…yeah, here, this one.
So when you follow this TCP stream, you can easily see that it’s an executable, but there is an easier way of doing it. So just filter it again, you go to file, export objects. And if you click on HTTP, Wireshark shows you all the HTTP requests, and this way you can dump the contents. One thing to pay attention here is…let me make it bigger. So if you take a look at the content type here, you see that most of the data is actually related to regular HTTP traffic, while we have some like, form data, so there’s a submission here. And then we have this x-msdos-program, which is the content type for the executables. So if you click on save here (and then let’s go to files and folders, sorry, not this one). I already saved it here, to software updates. And now we have the data of the executable that was downloaded into that endpoint. And if you pay attention, this is the web server, we have received the alert, so that was the source IP. And let’s have a quick look of that file and see if there are anything significant about that file. (Let’s copy as path.)
And this was like just an hour ago. It was not detected by any anti-virus. So if you make a quick Virus Total search on this file, you’ll easily see that it’s full of alerts. So 46 security vendors flagged this file. And actually there’s something to pay attention here: having an executable that doesn’t have a digital signature, which is the case for this file (so if you go to details page, you’ll see that it’s unsigned) and it was created very recently and having no…even if you’re not able to find the hash of the file in Virus Total, which is by itself an indicator of a suspicion, which is the case here. And we have just uploaded the file 18 minutes ago, and now it’s detected. Actually this is a Metasploit binary, so it’s pretty normal to get this many detections. So that’s what you can do with PCAP files. I mean, you can dig deeper, you can get more information about the file.
(And let me go back to the timeline page. And this is the one we have started here. So let’s go with this one and let’s maximize it. So we see it better.) So here, I also want to have search (so software updates) and a quick search highlights that we have like this file, which was downloaded from an internal web server, which is one of the things to pay attention because this file will bypass IPS in most of the cases, because it’s not coming from the internet, it’s a local traffic, and that’s why it’s harder to detect. And it was downloaded and saved into – I mean, we have had this information in five minutes, so as you have previously seen, we have started the timeline and in five minutes we have all this information from the endpoint. And if you take a look at the timeline above, like this one, you see that it starts from 1999, which is the information showed on some files if they don’t have…I mean, that’s what you see in Windows basically. So some files are shown, like with really old dates, so that’s why you see it. But basically whatever you see here is the information that was created on this endpoint, starting from the installation date of this endpoint, so we have a full picture of the endpoint.
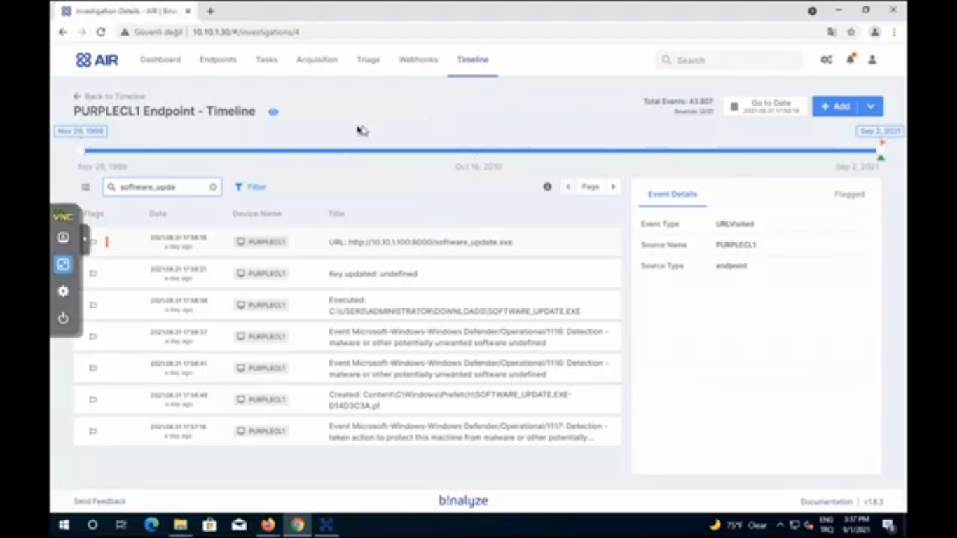
And then it was downloaded and it was executed, which we catch from the prefetch files. And then we had an alert, again we have another alert, but in this case, I think actually admin, like clicked along, so it executed anyway. And so that’s the information we can have, like right away after seeing that file. And if you want to further enrich this file, this is where the enrichment comes into the picture, because we have NetFlow data here. If you want to use that data, you can easily click on CSV file here. (And then…let me go to that one. We have a number of cases here, so let’s find which one of that has it. It should be the second one, I think, but let me make sure. Okay, this one.) So I’ll use this CSV file for enriching that timeline. (Let’s click-shift. Okay, let’s copy as path.)
So now we have a timeline that is collected from the endpoint, and we have almost everything on that endpoint. And we want to enrich this investigation by adding a new CSV file, which is the NetFlow file in this case. (So let me paste it here.) And AIR shows you a quick preview of the file and this way you can easily see what is in this file. (Let’s give it a name as NetFlow.) And then in the next step, we will provide an event type, let’s say connection because this CSV file doesn’t have an event type because it only has the connections from source to destination. So if it had any column that had an event type like, connection open connection closed, we may have used that, but that’s not the case for this CSV file. And the reason is it’s a CSV agnostic, so you can use any CSV for enriching a timeline. And we’ll also use the timestamp here and then a title, we can use the destination address, so that we can see what is the address that is connected from the same point. And then a device name: device name is the PurpleLab, which is my current lab for testing these type of stuff. And if you have a username, you can type it, or if the file has it. And I will also select all the attributes here for enriching every event that is imported from this CSV file. In the next step, I’ll import all records. And then it shows us a final preview and clicking import, in around three seconds, we have our timeline enriched and then let’s search software_update again. Now, we have everything embedded here. So as you see, like these are already information that is getting from the CSV file itself.
All right. I think we’re done. That’s all from my side. We can get the questions if there’s any.
Steve: There are, there are a few questions, actually. First of all, could we use the same methodology to extend out into triage: is there use cases for that, Emre?
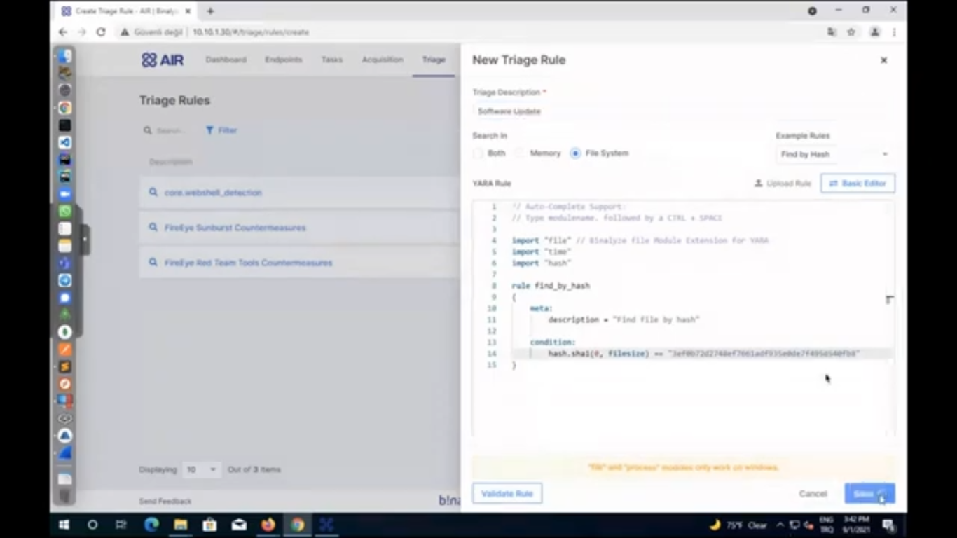
Emre: Yeah, exactly. So let’s also cover that quickly. Now we already have the file here. So now we already have – even if that file may have been deleted, which is not the case in this one, I mean, we already have that file on the endpoint – but even if it was deleted, just because we were able to extract the contents of that file from PCAP file, you can easily go to triage and then create a new triage rule, if you select the file system here. We already have some examples here. So if you select define by hash content and then you can easily use this rule, just replace the hash of this rule with the file hash, and then give it a name. (Let’s say software_update.exe, and save it.) Now we have a rule that will save, like that will search this across our enterprise. Coming back to the endpoints, you can easily select a number of endpoints here, and then run this triage on these endpoints. So that’s a feature we already provide.
Steve: Great. Okay. And we have, we’ve got a couple of questions. I realized we were kind of getting slightly short on time, but we’ll go through them anyway. First question is if we took a RAM image quickly, wouldn’t it be able to detect the malware again? I’m not sure what that means, but does that mean anything to you?
Emre: You can actually that’s, also one of the ways…there are a lot of ways to…
Erhan: I will reply this question, because I like this. Okay. Thanks for the good question. This is not always an efficient and fast method, actually, to take a RAM image and process it because each time an internal recon alert occurs, automatically obtaining a RAM image will be slow and may cause [??] problems, it’s not practical. And the administrative staff, in our example uses, for example, 32 gigabytes of RAM and it will take a long time to receive and process. However, it’s a very practical method to get automatic traffic capture or similar alerts via SIEM or SOAR. That’s the biggest thing, I think. In addition, when a special detection rule is written for the attackers network movements, it will be possible to detect and block the attacker before it jumps to other machines. It’s not easy to do this with RAM memory analysis, I think. Thank you. Great.
Emre: I mean, memory analysis is good, but when we started developing IREC, like almost four years ago that was a method I was using personally. I was always going with the memory, but due to the recent changes in the operating system, like having an encrypted memory and the size of the memory images, even though it may provide useful, it’s much easier to have a case report because almost everything you can get from RAM image is already provided by AIR. (So let me quickly show an example here.) So this is the information you will be getting from parsing a memory image. Like the running processes, the contents of the…sorry, the connections. I mean, it does almost everything. So most of the times you won’t need to run a memory investigation.
Steve: Okay. A question from me actually, Emre, does this impact on DRONE at all? Will DRONE have any network capture capability in the future or is there ways to integrate DRONE with network capture?
Emre: It’s great you reminded Steve, because that was one of the things we were planning to show…and it’s even like open here. So we forgot to mention…
Erhan: DRONE will detect all of the things automatically.
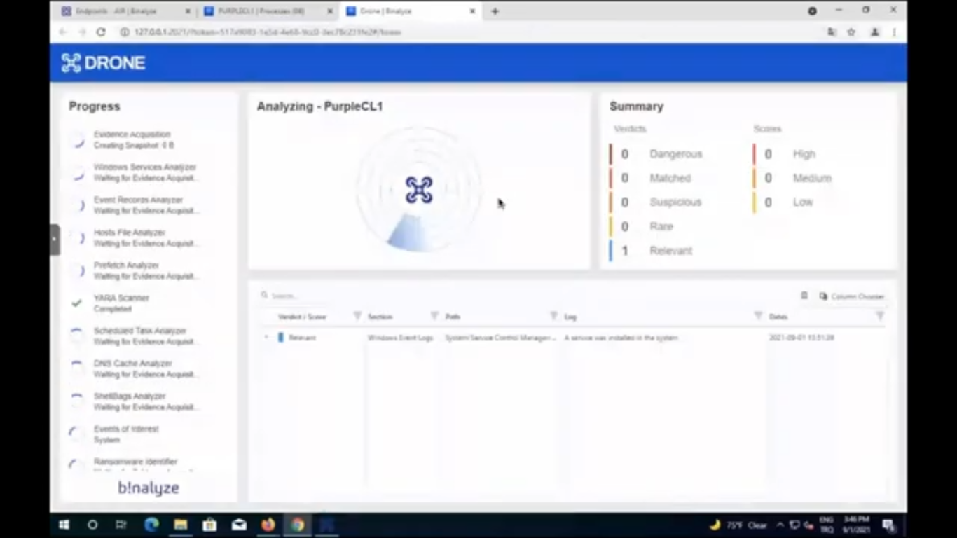
Emre: Yeah. So actually what we do here is we already executed this on this machine, and let me do it again. And just because we also have some indicators of compromise, like the things we are suspicious of, so let’s run DRONE and provide a keyword for that. And while it runs, we can easily…let me disable autopilot…and we have software_update.exe, so let’s only provide that one, and we already have all these analyzers enabled. And if you start running the mission, DRONE will automatically start finding a lot of this stuff that I have shown previously and even more. And in order like…be cautious of time, let me go to the folder and show you what it finds automatically. (This one…and here we have Drone.html, let’s open it with Chrome.) Thanks a lot for reminding me, Steve. I completely forget!
Steve: That was complete luck!
Emre: (Open with Chrome.) So DRONE, highlights even the stuff I didn’t see at first sight. As we always like talk about DRONE, it’s like having a highly experienced investigator, always available. So asking what’s wrong about the machine, DRONE quickly highlights this stuff that your security operation center analysts are supposed to find after spending some time on a case. Well, let’s wait for it to load the case, and then we can jump start. I think we are a bit over time, right?
Steve: Just a minute or so. I think we’re okay. I’ve got two more questions after this, so I think we’ll be okay.
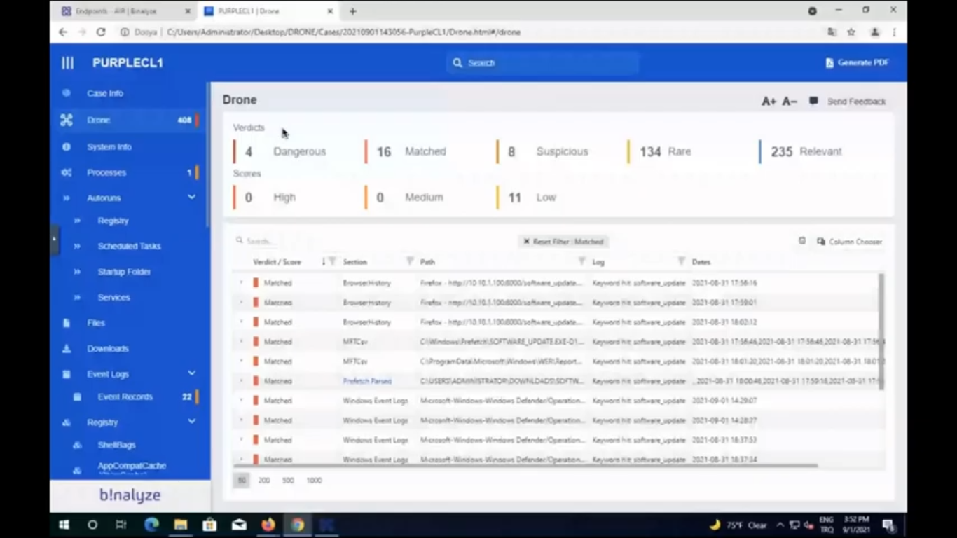
Emre: All right. So this one…if you go to the DRONE section on this case. So as soon as you run a timeline, 1.9 version of AIR is already coming with all these features. So when you start a timeline investigation on an endpoint, you already have all this information, like the detections of AIR. So as you see, we have four dangerous detections here, like the Real-time Malware Protection was disabled, which is something really suspicious. And we have some detections, which was one of the stuff we have seen in the timeline. And again, there is a (let’s click on the details, so you see more information about it). And this is the machine name, this is the name of the alert. And if you go to matched, we provided some keywords to this. And as you see, we see software_update in a number of areas here, which is in browsing history, it’s in master file table, it’s in the executed file, so it definitely executed. And we also see it in event logs. And I mean, these are the stuff that you’re supposed to see on an investigation, and DRONE is automatically highlighting them. We are running over time, Steve, I think we should get the next questions.
Steve: Okay. All right. That’s really good, actually. That’s very impressive. Second question or third, fourth question, I don’t know what we’re on now, but anyway: our EDR agent is installed on all endpoints. EDR gives us instant information. Do we still need to use this feature?
Emre: EDR can give you some…Erhan, I think you can answer that. Yeah. It’s your expertise!
Erhan: Yeah. It’s great question again. Actually, EDRs can show running processes and their activities in general. Okay, we know. But, and some of them can display the network activities of process at metadata level, not full packet capture. However, that solution provides extraction of the file downloaded to the machine. You can only achieve this true traffic. As an exception, solutions like maybe Carbon Black or something like that, each executed file in the binary store…so you can only get original file if it works, however there is a prerequisite…
Emre: Well, I mean, talking about files… This is for files, but not for every content. So I mean, some solutions like carbon black, they receive it into their management console. But they cannot get every single packet into their management console. So that’s just one thing to note.
Erhan: Yeah, that’s right. So there is no such prerequisite in network traffic. You can get the file whether it works or not. It’s not a problem on network side.
Emre: And one thing I want that add…The first thing attackers do when they penetrate into a machine is blinding the EDRs. So that’s why we always say forensic approach is highly, like different from the security approach. Because in security approach, you’re trying to find, detect, prevent something. But the first thing the attackers do is cutting the cable off. But that’s not the case in forensic approach because we are collecting everything on that machine: everything that left traces. So we are not supposed to be running on that endpoint for acquiring the information you see in this case report.
Steve: Okay, good. One last question then I think we’ll finish up because as we said, we’re over time. This might be a similar question, Erhan, I’m not sure, but: with a network IOC, we can obtain information such as IP address, URL, port information by using EDR or memory. Do we still need traffic analysis? Is that a similar question, or is that different?
Erhan: It’s some kind of different question, actually. Yes, we still need traffic analysis. It’s different because traffic analysis allows us to do this job faster. For example, when we detect attacker activity by specially crafted ICMP packets, for example, they are using that. This can be turned into a very good detection rule on network side, not using EDR. If you have an interior solution in your infrastructure that monitors the internal network traffic, you can define this customized CMP package as an IOC so that you will be informed immediately which endpoint data wants to comment on them, on their network. Yeah, if you do not use this type of interior solution because they are expensive, I know (it’s also valid for MSSP) you can analyze the PCAP records collected from thousands of endpoints. And for this custom ICMP package, again, in this way, we can detect all compromised service, so we still need!
Emre: Great. My addition to that, Steve: more visibility is always better. And the addition of this feature enables our users to have even more so that’s why…even though they may not use it in every single case, but now they know that when they need it, they’ll be able to get that information from the endpoint. That’s the biggest differentiator here.
Steve: Cool. Okay. Good. All right. Well I’m out of questions and I think we’re out of time. So thank you everyone for taking part in the workshop. Hopefully you found it useful. If you have any additional questions regarding network capture or generally about AIR, please reach out to us via the website (it’s probably the easiest way) and we’ll be more than happy to have a one-to-one and take you through all of your questions. So once again, thank you for joining us. We’ll see you on the next one, which will probably be in about two or three weeks time for the next release of AIR. And have a good day.
Emre: Thanks a lot.
Erhan: Have a nice day.