Steve: Good afternoon, good morning, good evening, depending on where you are in the world. Thank you for joining us again on this webinar. It’s to review our release version 2.1 and also to launch a new solution that we have now called Forensic Investigation Suite. My name is Steve Jackson, I’m VP of Growth here at Binalyze. I am joined on the call as usual by Tom, who is our Lead Solution Sales
Tom: Hi.
Steve: And also by Emre, who is the Founder and CEO of Binalyze.
Emre: Hi, everyone.
Steve: So, let’s dive in with the usual housekeeping that we do at the beginning. There is a panel on the right-hand side. Please do feel free to submit all your questions and comments about what we present to you during the webinar. We will answer all of these questions at the end of the webinar, and we really appreciate it if you can ask us some great questions. We also have a Discord server for more technical discussion support, and I will be pasting the link to the Discord server in the chat window in a few minutes. And also, existing customers, existing users of Binalyze products, technical support is always available. You can access support from binalyze.com/support, or by email at [email protected], or you can visit our knowledge base, which is kb.binalyze.com. So, let’s dive in.
So today we’re launching a new way to use Binalyze AIR. And as we’ve already said, we’re calling that Forensic Investigation Suite or FIS for short. So what I wanted to do before we dive into the technical demonstrations was just give you a little bit of background as to what the thinking is behind creating this solution and why we’ve got to the point we have today.
So, first of all, who is FIS for? It’s specifically for instant-response providers, forensic investigators and e-discovery practitioners. So service providers who do not require the endpoint to be permanently installed on their customers’ end points.
And why are we creating this? Well, earlier in this year, we came to the conclusion that there was far too much friction specifically with those use cases. And the way that we were attempting to sell Binalyze there was not aligned with how you guys are working.
So typically, or normally you have shorter engagement times, you don’t know the size and the scope of the investigation at the outset of the project, and it’s difficult for you to forecast how many cases, how many investigations you’re going to do in any particular period of time, whether that’s a quarter, or a year. So asking you to define these creates risk for you and risk creates friction. So with the launch of FIS, we’re aiming to remove all the risk and friction between us.
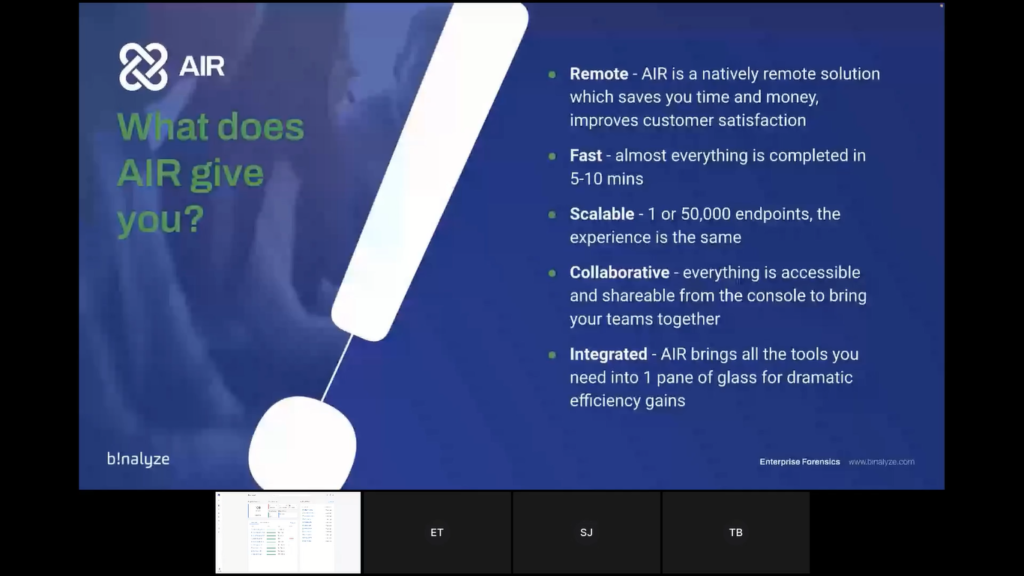
So what does AIR give you? First of all, AIR is remote, AIR is a natively remote solution, which saves you a lot of time and money, and also improves customer satisfaction, allowing you to get into the investigation much quicker than you otherwise would.
We’re obsessed about speed. Everything on AIR is lightning fast. Almost everything you can do on AIR is completed within five to 10 minutes, whether that’s evidence investigation, or timelining triaging, everything is lightning fast and we’ll show you that during the demonstration.
It’s also inherently scalable. Its architecture is built in order to deliver that. So whether it’s one or 50,000 endpoints, the experience is the same.
It’s also collaborative. Everything is accessible, shareable from the console to bring your teams together.
And it’s integrated. AIR brings all the tools you need into one pane of glass for dramatic efficiency gains.
So how is FIS different? So earlier in the summer, we launched a feature called ‘Organizations’ which turned AIR into a multi-tenant solution. And today with 2.1, we’re releasing a feature called ‘Cases’, which also allows you there then to overlay additional granularity so that there is a combination of organizations and cases to turn it into a full case management platform for DFIR investigations.
We’re also launching today 30-day licensing at the case level, per endpoint billing, and billing caps to 30 endpoints per case. The FIS model is also fully self-service and automated. So you don’t need to talk to us whenever you want to launch a case and it’s pay-as-you-go at the end of a case when the case closes, or you can purchase advanced credits if that’s better for your procurement.
So we’ve been beta testing this with some existing partners for the last four to six weeks. And this is a real investigation that we did with a partner in Norway just last week. So this partner was called to investigate initially for two computers, that’s what they were asked to go in and do.
Now using AIR and the FIS model they quickly identified the lateral movement and they ended up triaging 300 endpoints across the network. So as you can see from the chart here, the way FIS works is that over the 30-day investigation period, you can use as many endpoints as you like, and you will only be charged up to the 30 cap.
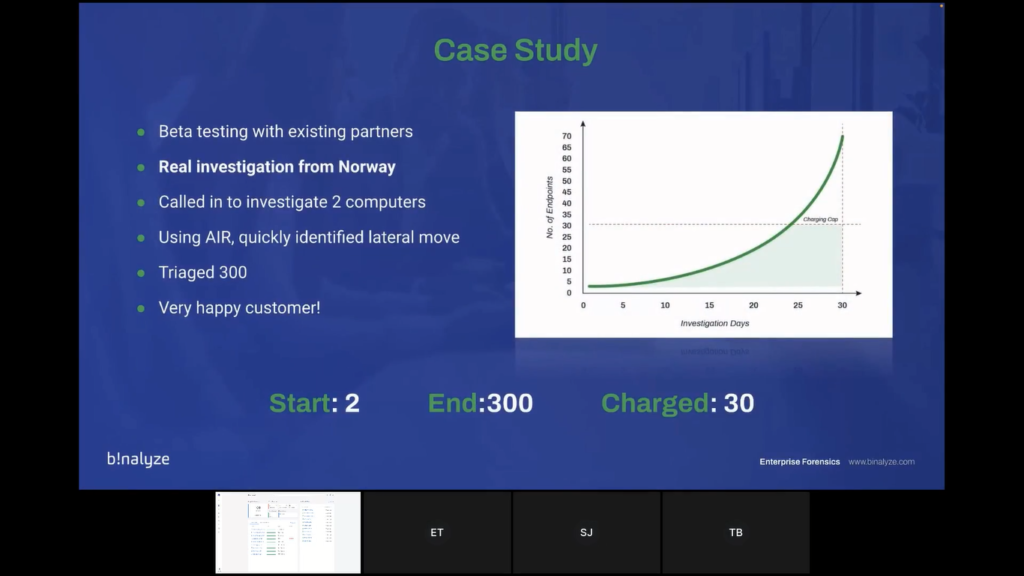
So that gives you that freedom to then perform additional services after the 30 cap, without any additional costs. So our end goal here is cost certainty and investigative freedom.
So let’s dive into the first part of the demonstration. We’ve divided the demonstration up into four parts to make it easy to follow.
So in the first slice of the investigation, we’re going to look at the AIR console management. So as I’ve already said, it’s browser-based. We have an organization’s feature to manage unlimited customers in a multi-tenanted way. We have comprehensive roles and permissions that are flexible and granular with more than 90 different variables and unlimited role definition. We have SSO and two-factor authentication for security, as well as a number of other security features, which we’re not going to focus on today, but we can go into detail if you wish. And we also have policies, asset tagging, and much more for effective management.
Also in this first part of the demonstration, we will show you how to deploy an endpoint onto the AIR console. We are Windows and Linux-supported, and we have Mac committed for Q1 of next year. It’s a passive agent which is important because I know that many clients are nervous about adding additional agents. So it’s super resource-light, and you can install it manually, or you can install it using Active Directory or SCCM, or even from PowerShell command or script.
And the final part of the first demonstration, we will also show you how to do off-network acquisitions, because we get asked this question all the time, and I think it’s especially relevant for this use case is how do we use AIR to investigate if the machine is taken offline or if it’s off the network?
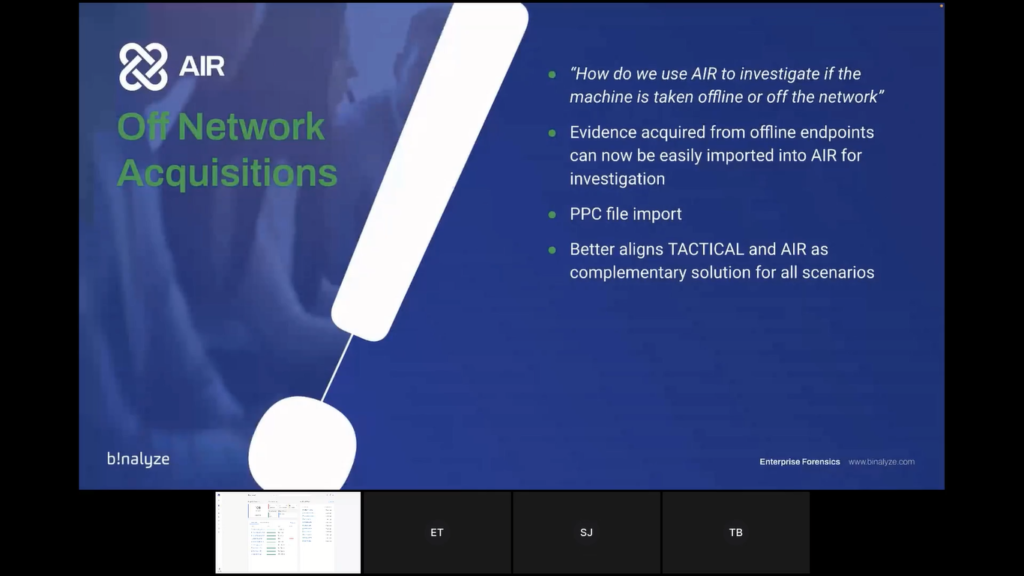
So we will show you today how it’s straightforward to bring evidence acquired from offline endpoints into AIR using our PPC file format. And that also helps to align with TACTICAL, which is our offline evidence collector. So at that point, I think I will hand over to Tom for the first part of the demonstration.
Tom: Thank you, Steve, let me take over the screen. And again, hi everyone. What we’re looking at now is the dashboard of AIR. As Steve said, it’s web-based, so this is simply just a webpage. And what we’re going to do in this demo today, we’re going to follow the scenario of an investigator or an incident responder that is starting an engagement with a new customer.
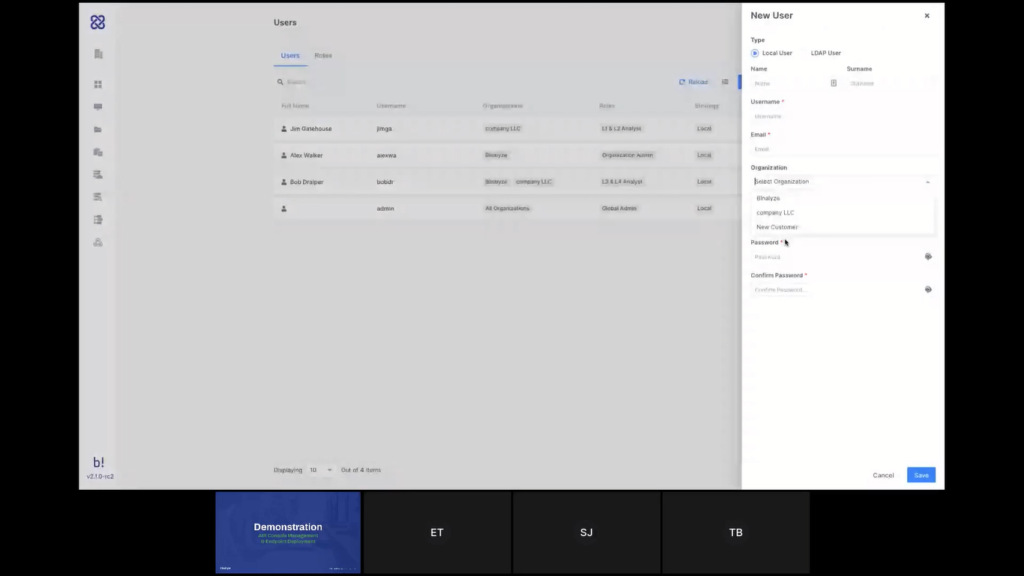
So what we’re going to do first thing is go into the ‘Settings’ area here in the top and into ‘Organizations’. And I’m going to create a new organization, let’s call this a ‘New Customer’. This and that new customer is created here. Now, that customer as Steve explained, that means that the entire system is basically split into three now.
So each customer has their own area in AIR and all the endpoints and all the data is segregated, so nothing gets mixed together, and it all works with permissions, as well.
So if you go to ‘Users’ and ‘Roles’, you can see that users can be assigned specific organizations. If I create a new user, I can select that new customer, and if I create that user now, this user will only have access to this new customer, and they will not be able to see the endpoints or the data of any of the other customers.
Steve mentioned the roles, as well. We’re not going to go into that too much, but you do have a lot of granularity to control what each one of your team members are allowed or not allowed to do, or to see in the system.
We’re not going to go right now into Auto Asset Tagging and the different security aspects that Steve mentioned because we’ve talked about these things in previous demonstrations, and you can find all of that on our YouTube channel. But what I want to do now is here in the left side menu of AIR, I have the ‘Organizations’ filter.
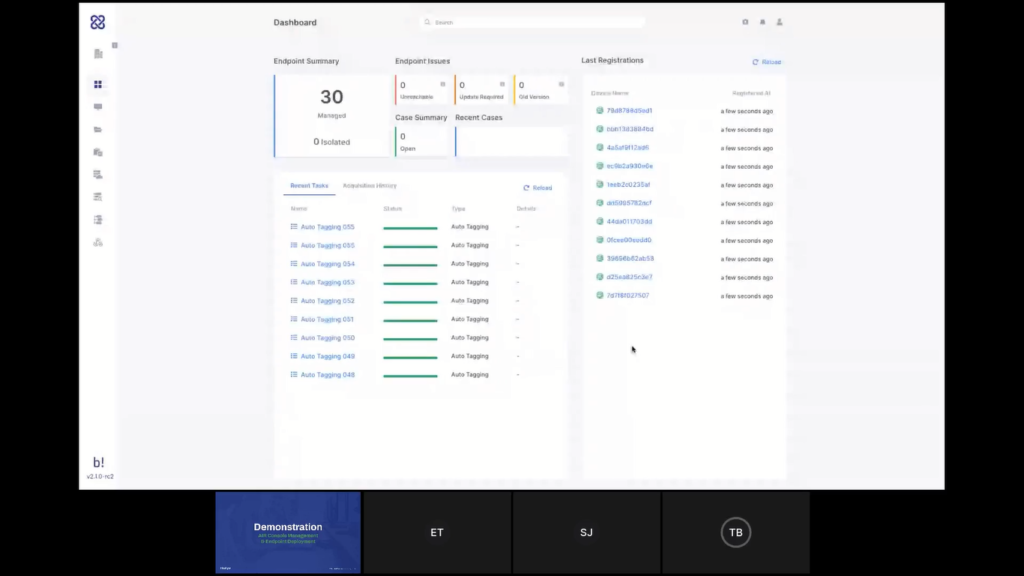
So obviously I will only see here the organizations that are assigned to my user, but I can also filter here. So if I filter out everything and just select that new customer and go to the dashboard now, as you can see, now I have an empty dashboard, cause I don’t have any endpoints for this customer yet. If I select the organization here and click ‘Next’, this is how I would deploy the agents to the endpoints.
So I can either download the MSI from here for Windows or I can use the PowerShell commands or scripts to deploy remotely, and the same goes for Linux Debian or RPM distributions. I can either download the package or use a script to deploy at mass.
What I’m going to do now for the demonstration is I’m going to deploy Linux Agents. Let me just execute that. And I now have Linux Agents being installed and you can see that right away they start to appear here on my console. I’ve installed the agent to 30 new endpoints now and within just a few seconds and we will see them all here. There you go, they’re all added. So now I have 13 new endpoints in my organization under this new customer.
If I go to the endpoint screen, I can see that this is the only customer that I’m looking at. And those are the endpoints in the investigation. So far, I haven’t started a new case yet. I’ve just started to prepare my engagement with the customer and therefore I don’t have to pay anything for the usage I have done so far.
The next thing I want to do is create a case. We’ll do that in the next phase of the demo, but one last thing I want to show before we hand it back to Steve is off-network endpoints that we’ve mentioned. So, same way that I’ve added those endpoints, and I can add more from here if I want to deploy new endpoints, I can also add off-network endpoints, and that’s even easier.
So if I select this, all I can do really is drag and drop a .PPC file, which is our proprietary file format. So I just drag and drop it here, and that will create that new endpoint with that file. So here’s the new endpoint now.
So now I have access to that data that I’ve collected with TACTICAL from endpoints that are not connected to the network. So at the moment, as Steve said, it is with TACTICAL, but we do have some plans around that in the future to make this seamless actually, to give you the same experience for collecting evidence from a network or an off-network endpoint. And perhaps Emre wants to add a bit more about that.
Emre: Yeah. Thank you, Tom. So currently we have programmed this functionality with the command line in TACTICAL. So if you run TACTICAL with the offline parameter you have a container that is created by TACTICAL and while creating this container TACTICAL does not require an internet connection. So you can easily run it on a machine that is isolated, that is plugged off from the network.
In the upcoming version, we’ll be adding a new button here. So that way you won’t be required to have TACTICAL separately, you’ll be able to download your file collector right away from here. That way it will be much easier to go both for online collections and offline collections.
Steve: Great. Okay. So let’s move on. Hopefully what you got from that first stage of the demonstration was that within just a few seconds, actually you’re able to create a new client and deploy the endpoint across their network and lay the groundwork and the foundations to do what we’re going to do in the second stage, which is start to investigate those endpoints.
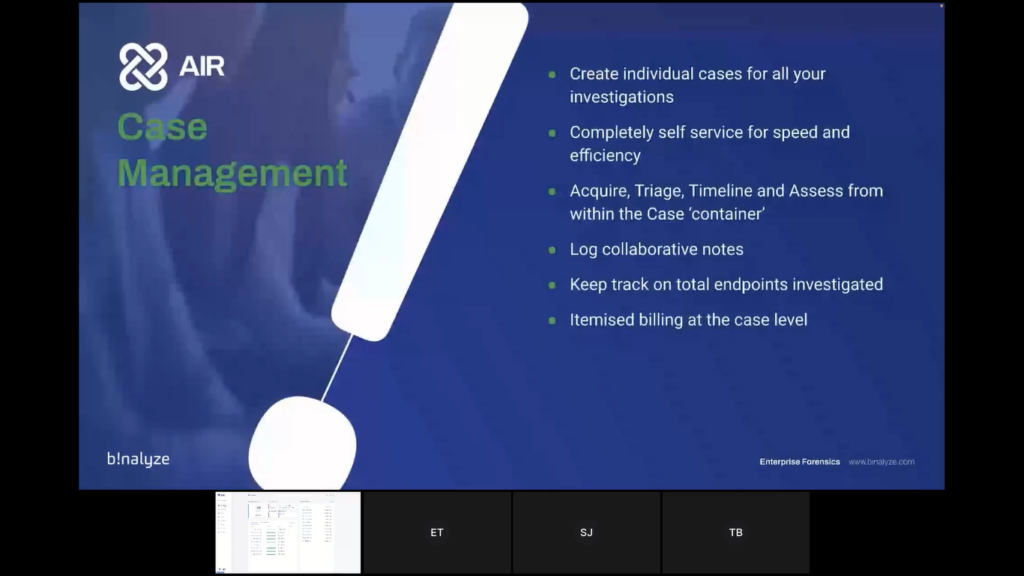
So, let’s have a look at that now. So what we’re going to see in the second stage is the Case Management feature. So the ability to create individual cases for all of your investigations, which is a completely self-serviced process. So as I mentioned at the beginning, we’re obsessing not just about speed anymore, but also about friction. So we’re trying to remove all of those points of friction within our process. So you don’t need to talk to us to create a new investigation or a new case, it’s entirely self-service and automated.
Within that case, you can then manage your acquisitions, your triage, your timeline, and your assessments from within the case container. You’re able to log collaborative notes, keep track of the total endpoints investigated, and at the end of the case period, you will get an itemized bill which is also a feature that our beta users have enjoyed. It helps tie things up from there end as well with the client.
We will also show you evidence acquisition. So this is really our core, where we come from originally, where Binalyze began. So our evidence acquisition is also entirely remotely scalable, extremely comprehensive, more than 150 evidence types, which Tom will show you in a few minutes. Lightning fast, less than 10 minutes, very, very rarely you see anything other than under 10 minutes for an evidence acquisition.
We also timestamp the evidence to help with chain of custody. It’s ransomware-shielded, it’s encrypted, it’s compressed, and we have a flexible set of evidence repositories that you can send the evidence to. And you’re also able to schedule and trigger evidence acquisition, as well. But most likely again, in the FIS example is most likely to be the on-demand, but scheduling and triggering is also available.
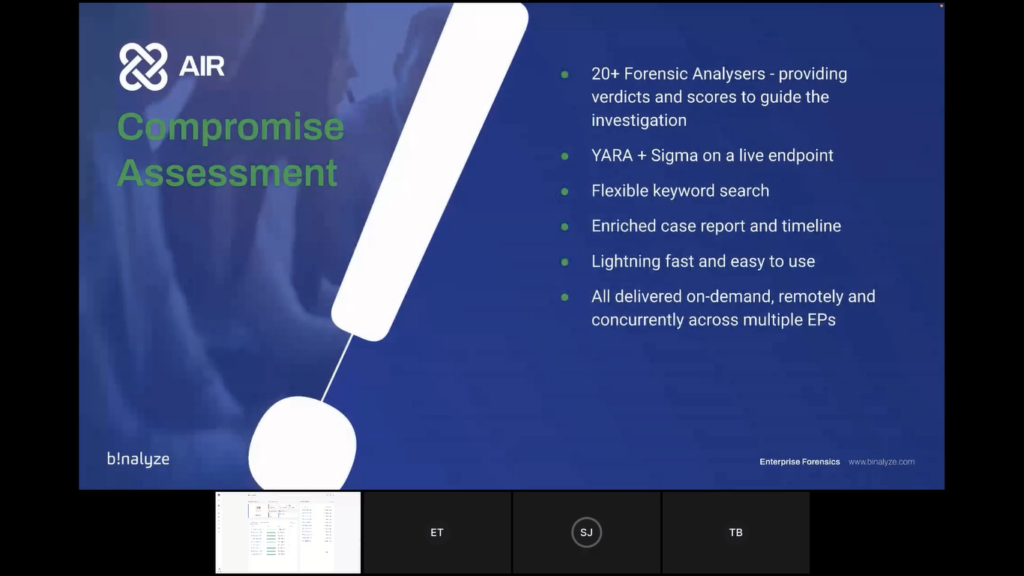
The third part of this stage of the demonstration we’ll show you compromise assessment, which is handled by our DRONE module. So DRONE is made up of more than 20 forensic analyzers that are looking at different parts of the evidence have been acquired and providing verdicts and scores to guide you in the investigation. So the aim of DRONE is to get you to the key parts of the evidence as quickly as possible.
It also does YARA and Sigma scanning on the live endpoint, really flexible, very powerful keyword searching, which again, Tom will demonstrate for you in a moment. And everything that DRONE is finding is enriching the case report, and also the timelines. It’s again, lightning fast and easy to use, less than 10 minutes, and it’s all delivered on-demand remotely and also concurrently across multiple endpoints. So, let’s go back to Tom and let’s see that second part of the demonstration.
Tom: Thank you, Steve. Okay. So now I’m going to go to that new Cases area. So over here we’ve added cases. And what I want to do is create a new case. First thing I need to do is name my case. So this one is just for the webinar, so let’s just call it that. Select the organization that this case belongs to, so that would be our new customer for now.
And who is the case owner? So I only have one admin in the system, one user that has case management permission. So that’s my only option for now and whether this case is Public to Organization or Private to Users. So Public to Organizations would mean any user that has permission for this to view this organization will be able to view this case. Whereas if I choose Private to Users, only specified users will be able to access this case.
So let’s create this case now and once created, I’m going directly into the case space and this is an empty case, so those are the actions that I can take from right here.
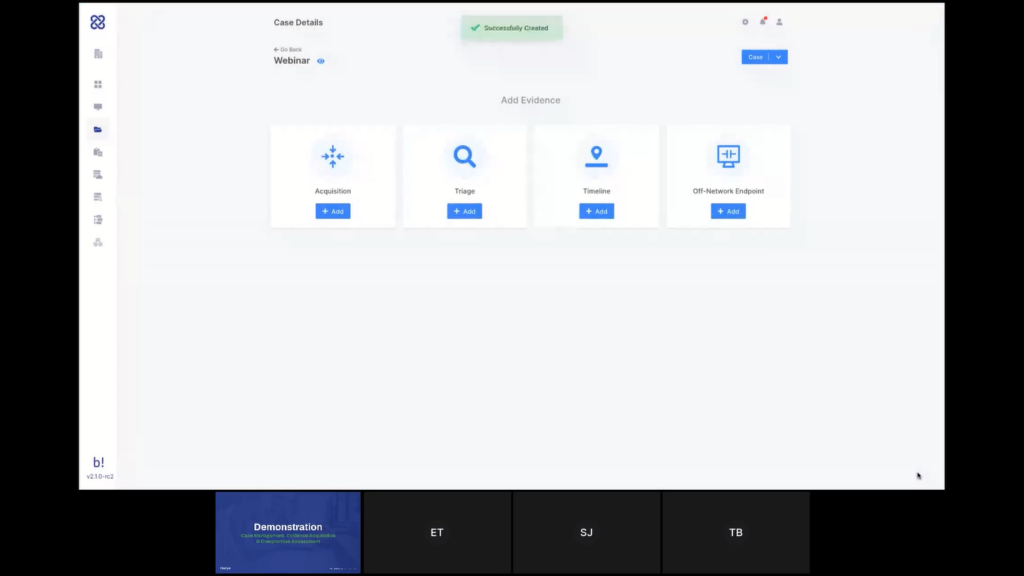
Let’s start by creating a new acquisition. So let’s add an acquisition. The name for the acquisition will automatically be generated based on the case. And I can choose the acquisition profile that I want to use from here.
So we have a few that are out of the box, but I also can create my own. If I click here, that would take me to ‘Create an Acquisition Profile’. And I’ll scroll really quickly through this list. Steve mentioned over 150 different types of evidence that are supported out of the box and different types of artifacts. Custom Content Profiles allows us to collect specific files or directories or even a specific file type.
So we mentioned the E-discovery use case, for example. So if I want to collect all of the OST files on the system, for example, I can simply do something like this, and that will collect all of the OST files on the endpoints, which this is assigned to. In the future, we will make it even easier than that to use.
Another capability that we have here is the Network Capture, which allows you to do very detailed network analysis. So actually a full packet capture that is running from the perspective of the endpoint itself. So it’s basically like running Wireshark on that endpoint, but you can do it remotely and you can do it on thousands of endpoints at the same time by assigning this to all of those endpoints. So that is creating a new acquisition profile.
Let’s go back and assign one of the existing ones here. Next thing I can do now is select where do I want the data saved? So by default, it’s a local directory on the endpoint itself. I can use this to specify a mapped network drive, as well. So if I want something like that, or if I’m applying this acquisition to a single endpoint, then maybe I want to save the network to an external drive or something like that, then I can do it this way.
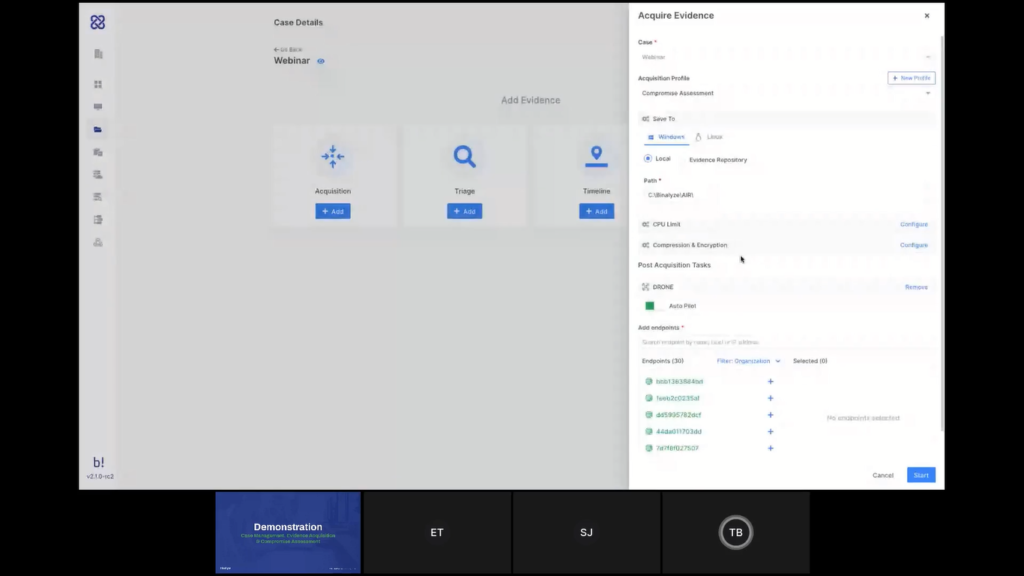
The other option is using an evidence repository, and we support all of these types of evidence repositories. You can either create a new one here or do that in the settings, and you can have, if you want a dedicated repository for each one of your organizations, for each one of your customers and even automatically have that configured for each organization to automatically save the data to that location. So all the raw data that’s collected will be saved to the evidence repository and the parsed evidence will be loaded directly into AIR so we can investigate it here. Let’s use the local for now.
Okay. Next thing here is DRONE that runs as a post-acquisition task. So after the data is collected, AIR will analyze the data as well for you. I can either leave it on autopilot, which will do everything that it can with the data that’s collected, or I can disable the autopilot and then I have more control over the analyzers that I want to use. And if I want to set a certain keyword, for example, I can do that as well and DRONE will try to find matches for that. The next step would be to select the endpoints I want to run this acquisition on. So yeah, just selecting like that, but it can obviously search, as well. And at this point I want to start the acquisition.
What I did now added 12 endpoints to my case. So at the moment, if I go to the details here, I can see that I have a total of 12 endpoints in this case, and this case is zero days old. So when this case becomes 30 days old, that’s the point where we will check how many endpoints you’ve used in that case. And if it’s 30 or less, we will charge you for the amount or actually 29 or less we will charge you for the amount of endpoints that are in this case. If it’s 30 or more, we will charge you only for 30. And that is for a period of 30 days. So if you want to go over the 30 days, that’s fine, but it will be charged again.
At this point, maybe one more thing to show here before we move on to the results of the acquisition and I’ll let Emre explain a little bit about that, Just to get familiar with the case container, the case area, so I have here the list of the endpoints in my case, I can select endpoints in here if I want to apply further action to a specific set of endpoints, or I can select all of them.
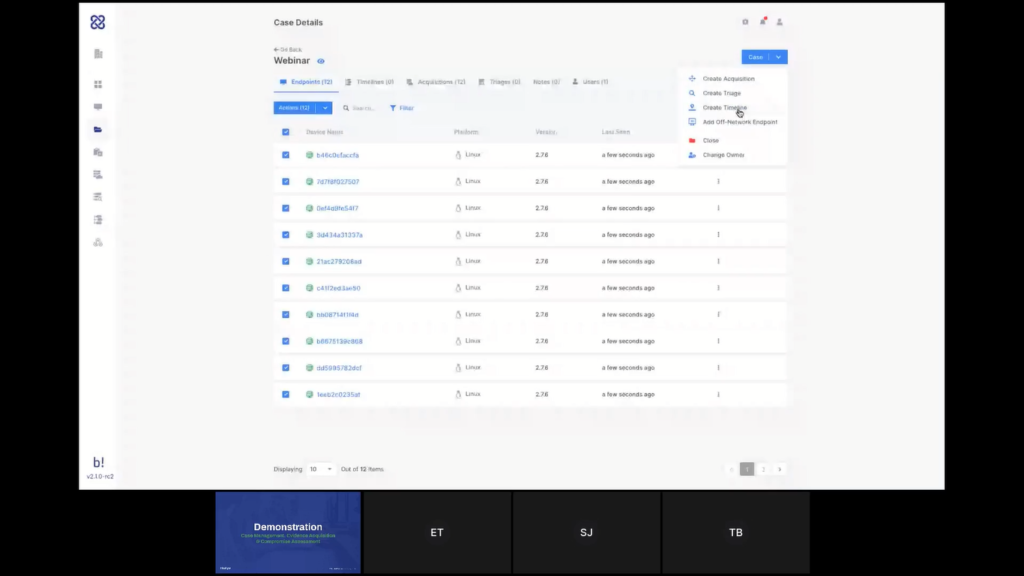
And I can also create new tasks from the menu, the case menu here at the top, and this is where I see my endpoints; I have my timelines, my acquisitions here, my triages, the users that are assigned to this case and my notes here. Notes is where I can add my investigative notes and this is a very good tool for collaboration. So I would see all the notes that were created for all the users in the case here with the timestamp. So it’s a good way to collaborate on the case with your colleagues. Let’s go to a case that I’ve created earlier today. And let’s go to see one of the acquisitions here and we’ll let Emre talk through the report.
Emre: Thanks a lot, Tom. So previously we supported the Organizations feature. That was a great feature because it allowed our users to cluster the endpoints seamlessly. So you don’t need to do anything, you just create an organization and pass the MSI package, that is zero config, all of a sudden in a few minutes, you have all the endpoints clustered.
Now, with this case feature, we have one more fine grained control. So you have cases inside the organization and when it comes to the reports, this report is a result of 10+ years of R&D and four years of continuous development. Basically, it’s what we call a case report. You can think of it as the highest resolution crime scene picture of an endpoint. It can be a regular investigation, just like almost all of our customers are using every day.
So whenever you receive an alert, in order to investigate that alert, when you have this case report, you don’t need to do anything else. You don’t need to connect back to that machine again. You can even turn off that machine, or you can isolate the machine because 99% of the time, you won’t be required to connect back to that machine. Once you have this case report, you can easily navigate in the left section as Tom is doing now.
So as you can see, it has everything organized into the appropriate categories. And just by clicking on them you can see the results. We pay great attention to parse all the evidence. So just like Tom mentioned previously, if you’re collecting evidence that has big file sizes, let’s say the RAM image or page file, these evidences are sent to the evidence repository, but whatever we can parse from this evidence is collected into this report and presented in such a way so you can easily click on the folders, apply filters, but you can easily sort them.
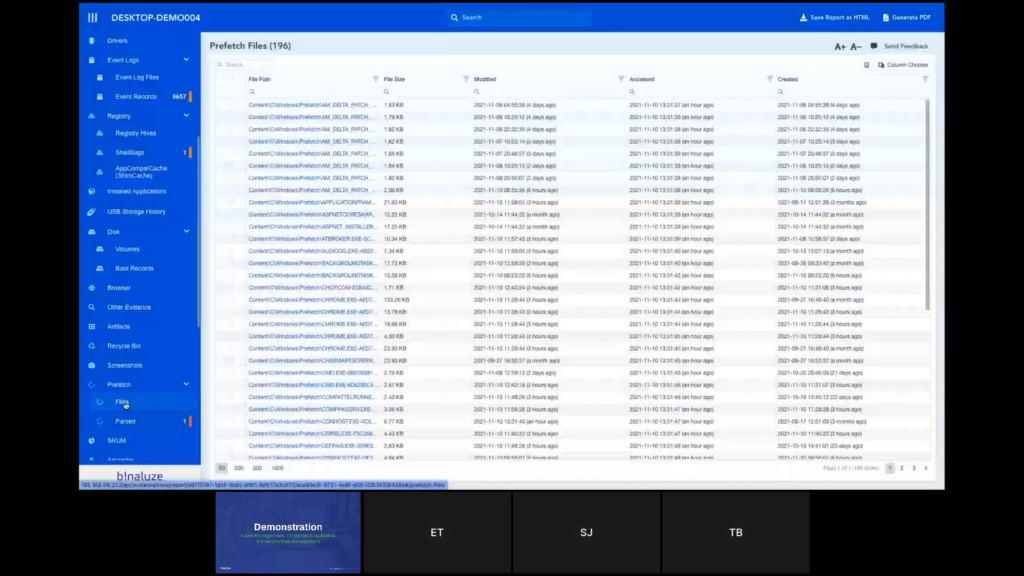
We can also make a global search by typing it into the top input box, let’s say svchost and then it shows you what are the sections that are matching into that keyword. And you can also export this and save this as an HTML file.
One thing to note about this case report is it’s self-contained. So whatever you see here, when you save it as an HTML file will be visible in the HTML report. So even you can forward this to an investigator or to a colleague of yours, and that way even if they don’t have access to AIR, you can easily share the report, and you can also mark some of the evidence just like Tom is doing right now.
And another thing to note is these bookmarks are persistent, it uses the local storage of the browser. So even if you close this one, and then reopen it, you’ll still have the bookmarks available. And for reporting purposes, you can easily generate a PDF and save it. This report can be used for both creating a report for the customer, because that’s what customers are asking for and you can also use it internally for training your new employees. So that’s all you need for starting an investigation and 99% of them finishing an investigation.
Tom: Emre, a few words about DRONE, as well?
Emre: Yeah. So the first simulation of AIR is it lets you collect evidence in around five to 10 minutes. And once you have this collection, the second stage is investigating it. And for this reason we have a lot of people on security operation centers and MSSPs. So their responsibilities are taking a look at the crime scene picture and trying to understand what is wrong, what is different, what is rare or dangerous.
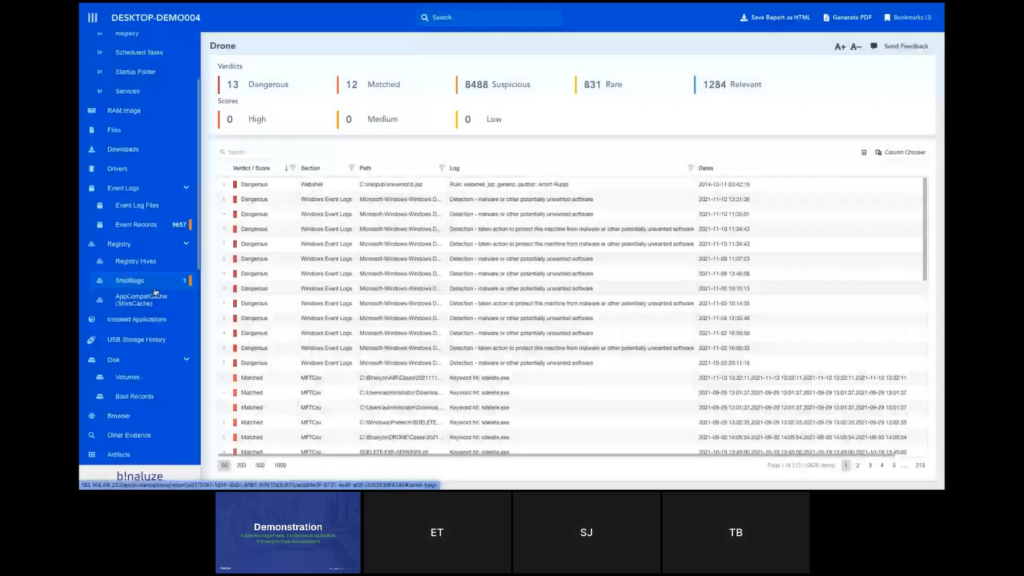
DRONE in the second stage automates this process. So it’s just like showing this case report to a highly experienced investigator that has years of experience and asking him to highlight what is wrong here, what is different, what is the stuff that we should pay attention to first? And if you take a look at the top section, we have two roles there. The first one is Verdicts and then the second one is Scores.
And DRONES is working with the idea of pipelines, investigation pipelines. So every evidence on the left section is passed into an investigation pipeline. And this pipeline is taking a look at the properties of each evidence and increasing score or applying some verdicts.
As an example, we have some dangerous items because DRONE was sure that this is a web shell, or there were some event log entries that show us there was a detection of malware. And this is the stuff our level one level, two analysts are spending literally hours detecting.
With the help of DRONE you don’t need to spend hours identifying this smoking gun. DRONE immediately highlights this in around five minutes. And another thing to note is this isn’t a synchronous process. So once you make an acquisition, you immediately have access to the acquisition report except the DRONE section.
So once the acquisition is complete you don’t have to wait for DRONE to finish because it may take another five minutes, you can start investigating a case right away. And in parallel, DRONE is running in the background for analyzing the evidence and in around five minutes, you have the section that shows you all the stuff that you should be looking at first. So you don’t need to search for the needle in the haystack. That’s how it works.
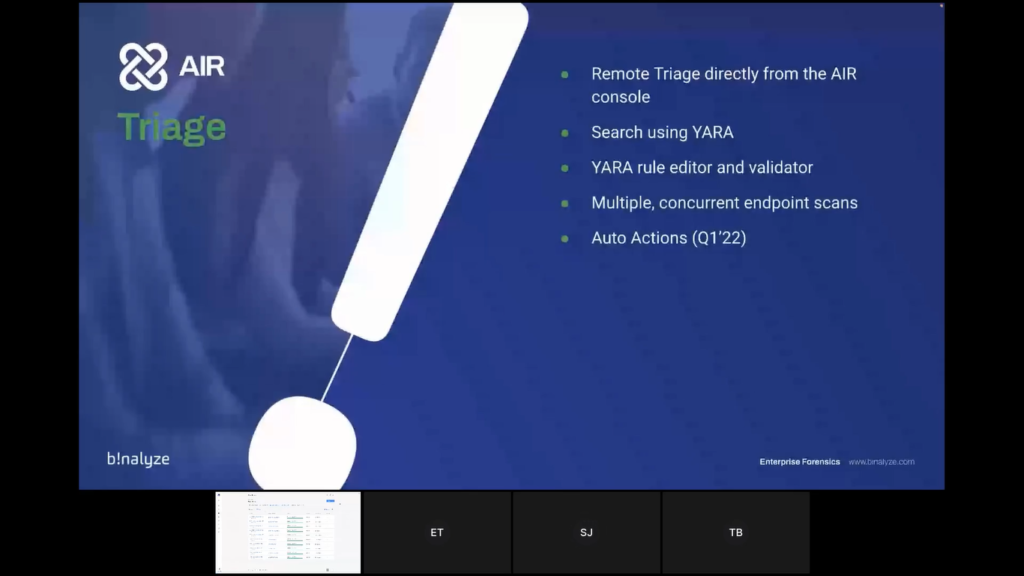
Steve: Lovely, great. Okay. Back to me. All right, this is a quick handover this time. So now we’re going to look at Triage. So, logical flow. We’ve acquired our evidence, we’ve investigated our evidence, we’ve done our compromise assessment, we may have found some indicators of compromise and now we want to look across the rest of the network to see where else this has been impactful.
So we have a Triage module on the AIR platform which allows you to remotely triage multiple endpoints or a single endpoint at the same time. It is also searching using YARA. It has a really nice YARA rule editor and also has a validator to prevent you sending triaged searches on which you work. And it allows you to do multiple concurrent endpoint scans.
Again, as I mentioned at the beginning, the architecture of the way that the AIR works, allows us to provide that level of scalability without seeing a degradation in performance. And coming next year, which perhaps Emre can touch on after Tom’s done the demonstration, we have a new feature called Auto Actions which we think will definitely take our triaged capabilities to the next level.
Steve:Tom, back to you.
Tom: Thank you, Steve. Okay. So back to our demonstration and back to our case. So we are again at the endpoints screen, and now I have a few different ways to start a triage within a case. So if I am looking at the endpoints that I have specifically in my case, I can select the endpoints that I want to run the triage on, or even select all the endpoints in my case and apply the… nevermind. Let’s just select a few and apply the triage task this way.
Or, if let’s say from the use case that Steve described earlier, I’ve started my investigation with two or three endpoints, but now I’ve seen some lateral movement and I want to scan across the entire organization. I can just go here and create the triage from here, and then I can select the endpoints in here. And now I see all the endpoints in the organization and not just the ones that are inside my case.

Again, the task name will be generated automatically and I can choose the type of the rule that I want to use. So let’s just see an example. This is what our YARA editor looks like. So I can edit the rule here, as well. So we have auto complete and we have rule validation to make sure that there is no error in the syntax.
So let’s say I want to replace the hash here, I can do that now and just save this. And now back in my case, I can select that rule and assign it to the endpoints where I want it to run and start the triage.
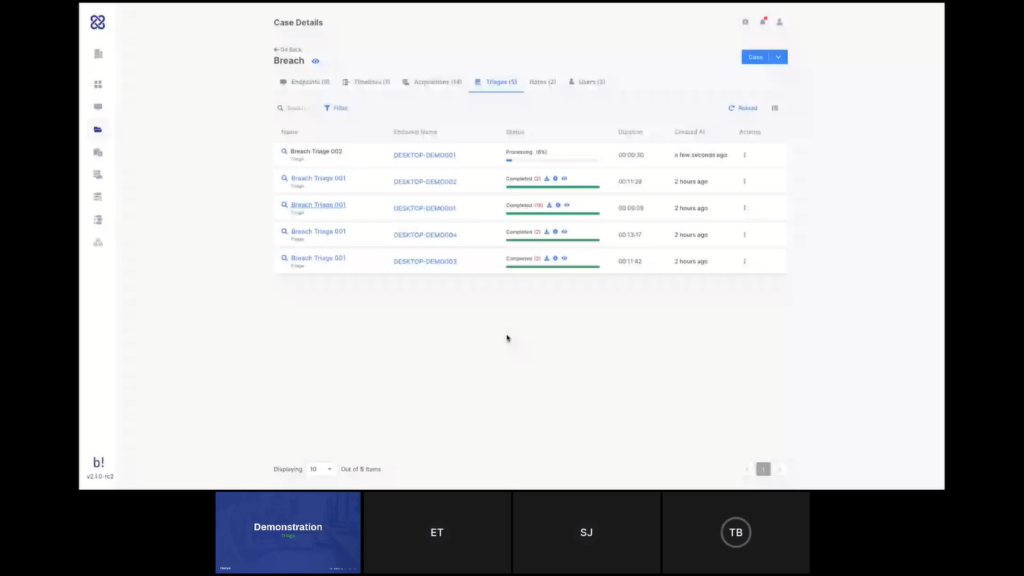
Now, while this is running, we can go here and see the ones that I’ve done earlier today. And I can see that we have found some matches to that triage on those different endpoints. And again, if I will click here, it will take me into the triage report so I can look at the findings in more detail. I believe that’s what we wanted to cover in the triage demo part. Am I right, Steve?
Emre: That’s right. It may look quite simple but that’s not the case with the other products. So that’s the beauty of AIR.
Tom: Emre, do you want to add maybe a little bit about what we’re planning and what’s coming in the very next version?
Emre: Yeah. so there are a lot of new features that are planned and we’re working on some of them. First, the problem of running a triage and then waiting for the results for performing some actions is causing hours, sometimes days, because if you are running a big investigation that like 10,000 endpoints, then almost 50% of them won’t be turned on.
So that way the biggest problem enterprises are having right now is they are running a triage and then they are waiting for all those endpoints to respond, but they cannot take action. So what we’ll be adding in the upcoming versions is we’ll have auto-actions. So whenever you have a match, you’ll be able to configure AIR. If there’s a match on any endpoint, apply these actions.
These actions can be creating timelines, these actions can be isolating those endpoints, or even with the upcoming version of AIR we are introducing a new feature that is called Interact, which will let you run commands on the endpoints. Using these commands, you can collect further data, you can run some actions on the endpoint. You can even use this for remediating those endpoints.
So, think about defining your workflow like a sequence of commands that will run some queries and then bleed some malicious files. So whenever there is a match, you won’t be required to respond to those matches manually, AIR will be handling this automatically. So it will be a breeze in the upcoming version. So there are more to come here.
Steve: Great. Super exciting. Okay. Let’s move on to the last step of the demonstration and then we’ll close up and hopefully you take some questions.
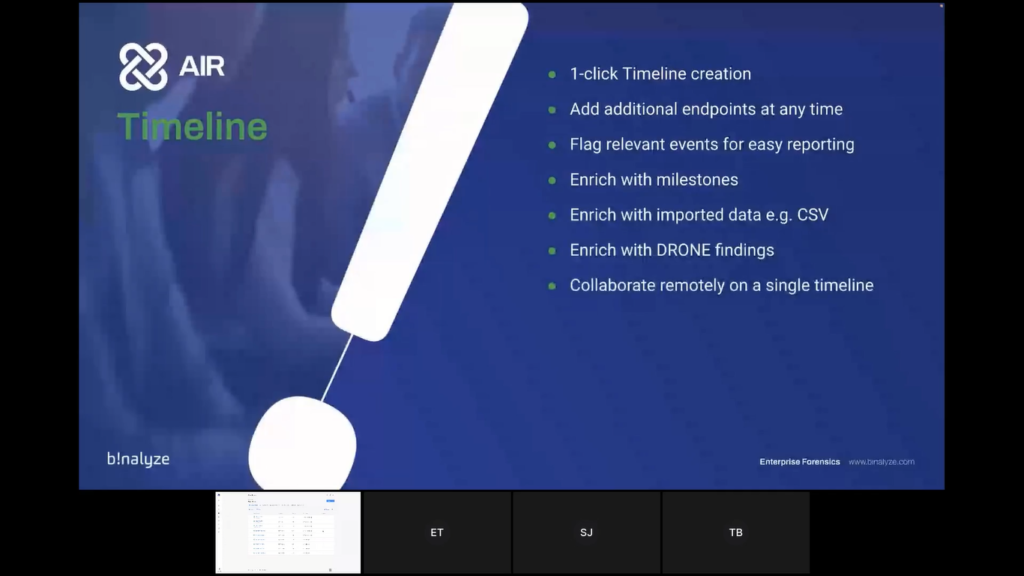
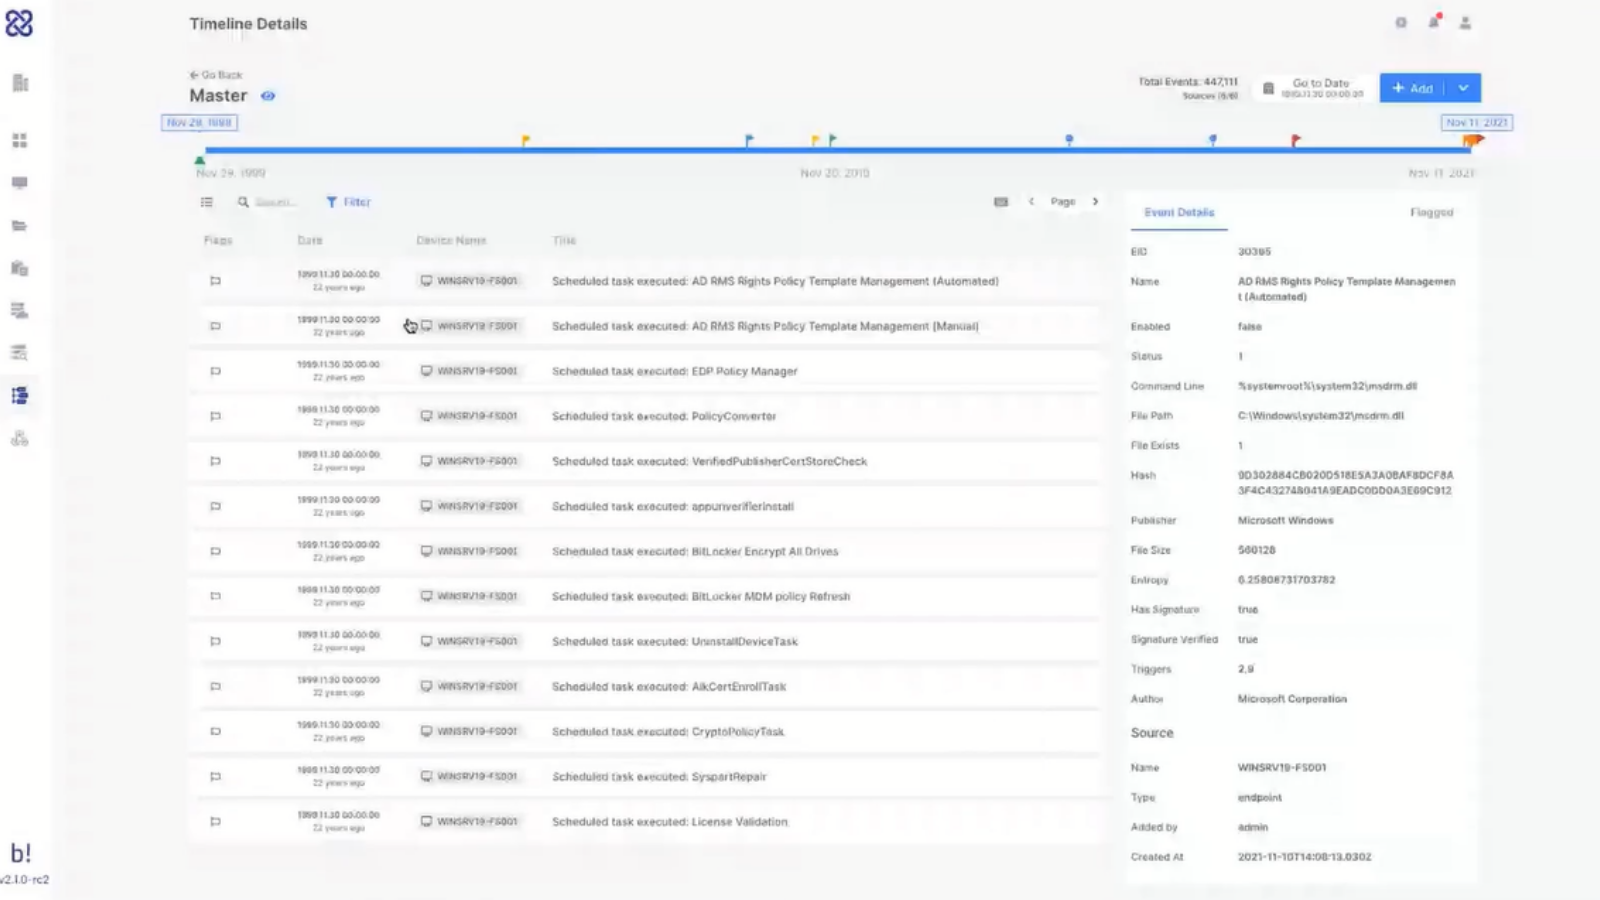
So in the last stage, again, following that logical flow we’re going to take a look at timelining. So within AIR, with one click, you can create a timeline and once that timeline is created, you can also add additional endpoints as your investigation develops. We will show you the ability to flag events for easy reporting.
We can also enrich with milestones, so qualitative data that you may get from offline sources, or even from conversations with the client. We can also enrich with important data, for example, firewall logs, file CSV imports, and the timeline also has the ability to be enriched with our DRONE findings, as well.
And again, because it’s natively browser-based it’s simple to collaborate with team members on an individual timeline, so you can work together to get to the conclusion quicker. So let’s dive back in for the final time. Tom, over to you.
Tom: Thank you. All right. So like everything that we’ve shown until now, there are a few different ways that we can start the timeline. I can select the endpoints. I can do it from the actions menu, or I can do it from the case menu. So let’s start with that and create a new timeline.
This time I do need to give a name to my timeline because we can have multiple timelines in a case. And since this is a central investigation tool, I want to know what I’m looking at and what I’m focusing on.
So for example, I’ve created earlier a master timeline, which I’ve just put all the endpoints in my case on that timeline, but maybe now I want to create a more focused one. So this is called focus. Again here I have the DRONE capabilities, so I can see if there any more details or just leave it on autopilot. And I can select the endpoints that I want to add to my timeline here and create the timeline.
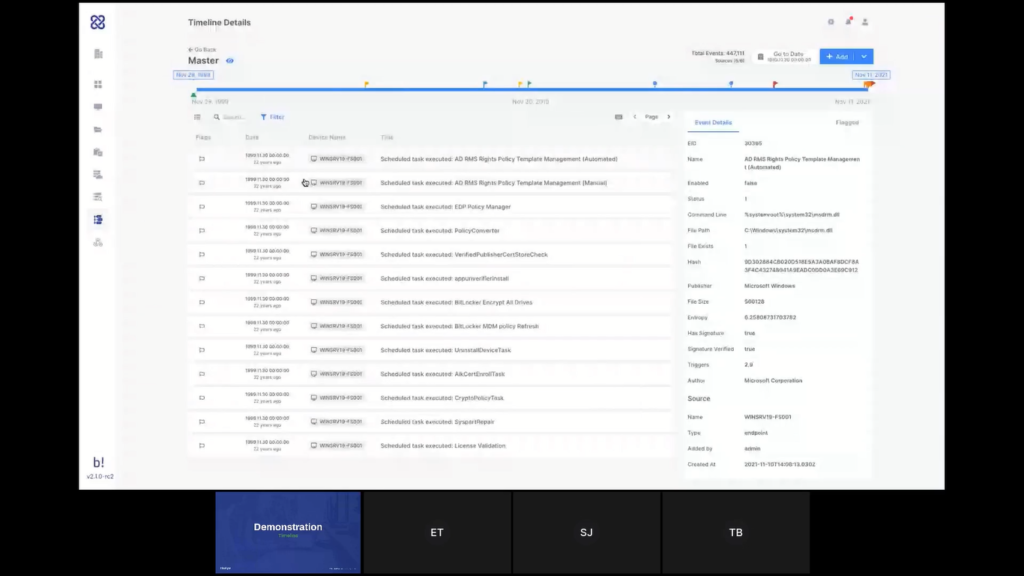
The system will now start generating the timeline and when it’s finished I’ll be able to see the data. For now, we’ll go to see the one that was created earlier and talk about that. So, my timeline, we’ll see, look at the details, we can see it consists of five different endpoints that I’ve added onto this timeline and have also added some manual information onto it.
Once a timeline is created, I can also always add additional data, either outing more endpoints, more live endpoints, adding off-network endpoints by importing the PPC file like we’ve seen earlier or adding a CSV file. And just by mapping I’m not going to go through the process now we’ve done it again in a previous demo.
But just by mapping the headers of that CSV, I can load all of that data onto my timeline. And Steve mentioned milestones, so I can add milestones to my timeline. And those are sort of like manual events. They appear on my timeline as markers for activity. What I’m looking at here is all the data from all the different endpoints that I’ve added on a single timeline. And that is very useful for when I want to focus on a certain event or a set certain timeframe to see what was going on.
So you can see data coming from the different endpoints here. I can also see all of the items that DRONE has flagged for me automatically, and I can add more flags myself. So if I see here something that may be relevant, I can add a flag to that, and that flag would appear here on the timeline.
Obviously I can search through this timeline. I can apply filters to make it very to focus on the specific types of events or a certain timeframe or anything like that. Again, this is something that is a collaborative tool, as Steve said, there’s nothing stopping multiple users in the case from working together on that timeline. And if I flag an item, it will appear here. And in a way that shows who’s the user who tagged that item. So other users can know that it’s me, Tom, who tagged this item.
Now, we are planning a lot more around a timeline and that’s improvements that will come during 2022. And I’ll hand it over to Emre to tell you a little bit, again, it’s a little bit down the road. So nothing is written in stone yet. As always feedback is welcome, but I’ll hand over to Emre to give you a little bit of our vision.
Emre: Yeah, there are actually a number of features here. The first one, like the immediate ones that we received feedback from our existing customers are being able to export this timeline. Timelining feature is a really powerful feature of AIR because previously if you don’t use AIR you need to parse disc images, get CSV files, and then you need to normalize those CSV files, and you need to do this for multiple endpoints.
That takes a lot of time. It’s an integral part of AIR. So you can start with one endpoint only, and then you can keep enriching the timeline until you are satisfied with what you see. And as Tom mentioned, it’s not limited with the endpoints, you can use any CSV file. Think about the LPL logs, think about CM logs or like firewall logs. And another thing is it’s CSV-agnostic. So you can use any CSV as long as it has a timestamp column, and you can easily map that.
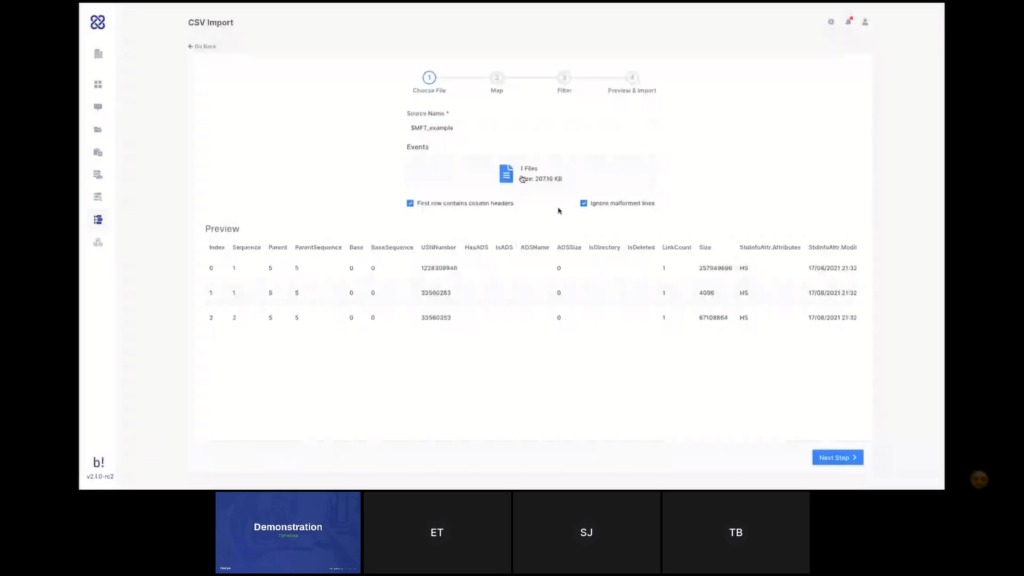
So the first thing we’ll be adding in the upcoming versions is we’ll be adding here import profiles. When you add a new CSV here, let’s say it’s an all security output. And you’ll be mapping the columns of that CSV file to the timeline properties. Once you do this, you’ll be able to save it as an import profile. So the next time you select a similar CSV that has matching columns with that profile, they’ll be automatically suggesting you, so that way you won’t be required to map it again. You’ll only map it once and then in the next import, you’ll be able to directly apply the profile. So it will be even easier.
The second one is exporting, and the third one is we are planning to add collaborative features here. Because you know, most of the time MSSPs have like dozens of analysts and they are working with shifts and most of the time they are split different cases. So once you add five analysts into this case, you’ll be able to see where they’re looking at.
In the top navigation bar, you’ll be able to see who is focusing on where, that way you’ll be able to split the case, let’s say to three analysts, and you’ll be able to ask them, okay, this is your part, and the middle section is your part, and the last section is your part. So there are a lot of collaborative investigation features on the way. So internally we call it the Google Docs of timeline investigations. And they’re super excited about these features.
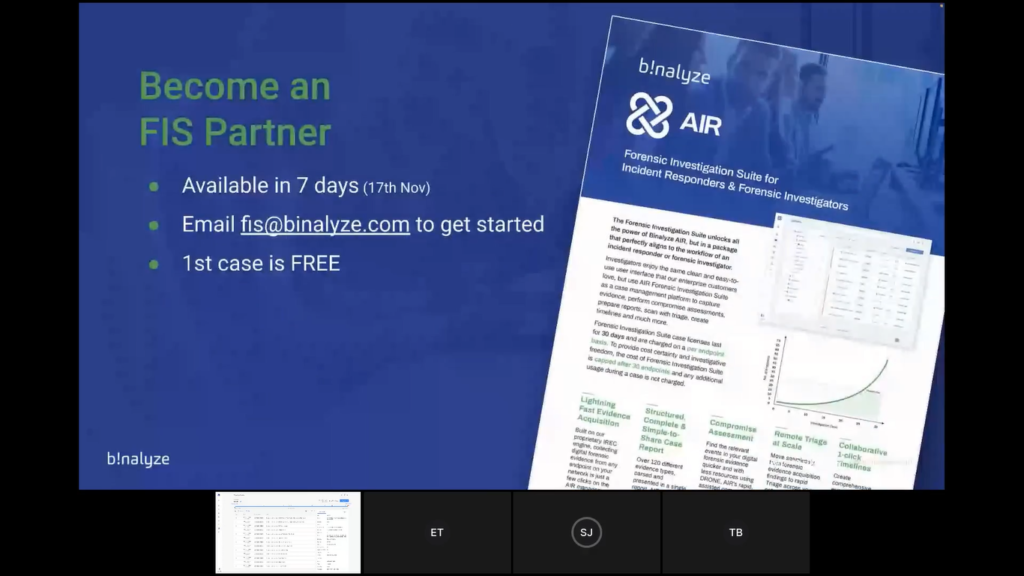
Steve: We certainly — Okay, great. I think that brings us to the end of the technical demonstration. So just a few commercial bits at the end. So if you like what you’ve seen today, or even if you’d like to just have a more detailed discussion, we will be releasing this as a stable version in seven days. So next Wednesday, 17th of November. So it will be available to use from that date.
If you would like to start a discussion or get yourself onboarded then please email [email protected] and one of the team will get back to you to make that happen. We are actually running a little bribe to get you on board. So the first case will be free. And as I said earlier in the presentation, the commercials are that it is per-endpoint-based and capped at 30 endpoints. So it gives you that cost certainty and investigative freedom.
If you want to have a try by yourself, we also launched another cool system two days ago, which is our self-service 14-day trial. So if you go to binalyze.com and you click on the ‘Try Now’ button, which is in the, in the header of the website, you can activate a free 14-day trial. It’s a full-feature trial, so nothing is blocked except the number of endpoints, obviously. And you will be operational in just two minutes without talking to anyone at Binalyze. It’s completely self-serviced. So if you want to get your hands on the product and have a play by yourself then feel free to do so. We would be delighted to have you on board.
Okay. So questions. I have seen one question come through so far, which is, “How long is the case data kept on the platform (export and backup)?”
Emre: Can you ask it again?
Steve: How long is case data kept on the platform? So I think we’re talking about closed cases. How long do we keep the data?
Emre: We don’t like purge the data as long as you want. The only thing we do is like we are closing the case. But closing the case doesn’t mean you will lose access. You still have access to all the data collected, all the timelines, acquisitions triage, but you won’t be able to add a new endpoint. So currently you can close a case and we are also able to archive the case. So the answer is it stays there, I mean, as long as you need it.
Steve: Okay, good. And I’ve just seen another question come in on the chat actually from Adrianna. Thank you, Adrianna. She says “After malware, what other information is extracted from the triage?”
Emre: Actually, the number of evidences collected is the same. So once you have a triage, you have the matching files and processes. So, the current version provides you with the capability of running YARA as a triage and in the upcoming version we’re also adding Sigma rules. So you’ll be able to run both YARA and Sigma. And once you have a match if you run an acquisition and as we mentioned previously, we are automating this process. So as soon as you have a triaged match, you’ll be able to collect evidence right away automatically. And the number of evidence is the same. I mean, AIR in the latest version supports collecting over 150 different evidence types. And these are split into four different categories as Tom previously mentioned. So the amount is more than 150 different evidence types.
Steve: Good. Adrianna, hopefully that answers your question. If it didn’t, if you want to type a supplementary one in the chat, that would be great. I think that is the end of the questions. We’re always short on questions. Everyone’s shy, I think. So…
Emre: It could be because there were a lot of emojis Steve.
Steve: Oh, Adrianna is typing. So let’s wait. She says, “Thank you.” and “Excellent.” Appreciate it. Okay. I think in that case, we’re over time. So let’s end here. Hopefully you’ve liked what you’ve seen. If FIS fits your workflow and the way that your business runs, we would love to have you on board. So please do reach out at [email protected] and we can start that conversation. Thank you. Thanks for your time.
Tom: Thank you very much.
Emre: Thanks a lot.