In this short presentation, Trufflepig Forensics’ Aaron Hartel and Christian Müller present some early stage research about the volatility of data in memory as data structures change version to version.
Session Chair: We’re now going over to memory forensics and specifically we’re gonna talk, or learn, about the heap, and I’m just gonna introduce Christian Müller, who’s gonna join us virtually.
Chris: My name is Chris, I’m from Trufflepig Forensics, and I will talk a bit about the heap and our research around the heap. I will start with a short introduction, then talk about version stability and why we even do that, demonstrate parts of the work and give an outline of what we still have left to do. And I can already say this is pretty early stage research, so there’s a lot left to do.
Yeah, as I mentioned before, my name is Chris. I’m one of the co-founders of Trufflepig. We are doing memory forensics, so also this research is in the domain of memory forensics. And in memory forensics you have the problem that was mentioned before in the SSH talk, that data structures are changing from version to version.
And in memory…as memory itself is volatile, also the data structures are pretty volatile from version to version, as you don’t need to worry about adjusting the parser or anything. So, one version may look completely different than the other one.
For example, in the Linux kernel there you have even to…in the compile time an option to randomize the structure in the kernel to prevent some sort of exploitation techniques. Yeah, and we are trying to get version stability also in Windows. So, right now we are focusing on Windows forensics and memory forensics and also in the Userland.
And as we are just starting out with Userland analysis we’ve started taking a look at the Userland heap, namely the NT backend heap, which is a first heap implementation from Windows. I won’t talk much about that because there’s more interesting things to tell you.
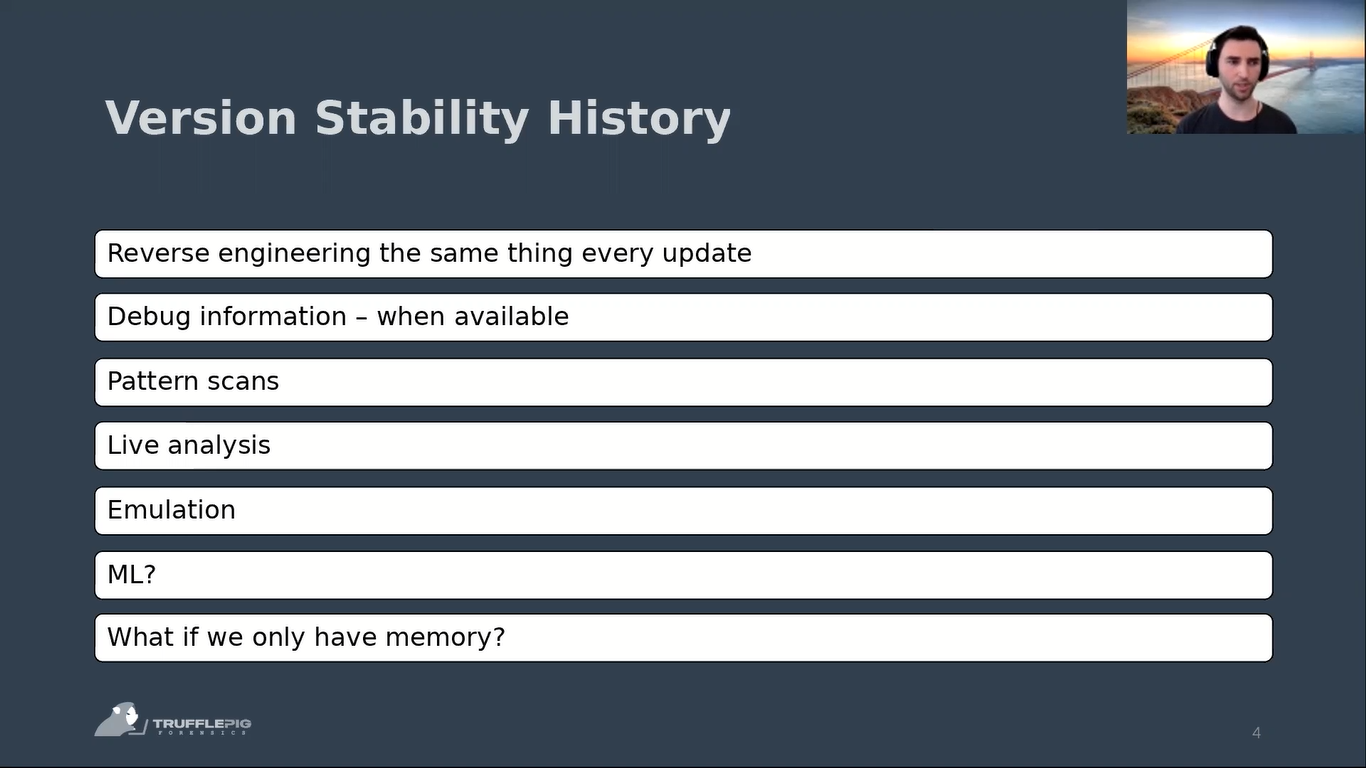
Yeah, bit about version stability. So, when you want to find out how the data looks in memory, you can either reverse engineer the same thing every update and try to make sense of the offsets and get the information in a profile. If debug information is available, you can also use that.
So, for example, for memory forensics profiles, that’s a common technique for Windows as they do give out some debug information for the kernel that you can retrieve a lot of information from, but sometimes it also takes a long time until you get that information for a new kernel, up to several months. So, it is good to have to have alternatives to that.
Yeah, so a better practice to get new offsets and information on where data is located in memory is pattern scans. So, you basically reverse engineer the source code, try to find references to the structures that you are interested in. And with those references you try to find pattern that are version stable for those code segments accessing the data that you’re interested in.
That works relatively well, so you can have, like, 10 patterns and you will match the data structure that you’re looking for the offset of the global symbol in, like, 10 versions, or maybe even 15 versions. And then you sometime need to add new patterns to find it also in newer versions.
Then you can also use, of course, live analysis, not just like taking a look at the binary itself, but also do it in live memory. Try to introduce known values in memory.
As an example, in the implementation in the Windows kernel 4 networking is completely undocumented, there are no debug information available. There is some reverse engineering work related to that. And yeah, it’s pretty good, but there are some things missing, especially for newer versions, there are some offsets missing.
And it helps to just start an application that you know which port it will use, and then just scan that port in a range, and you will pretty quickly identify that port and you’ll be able to update that specific offset.
There are other offsets that you can…also be able to write heuristics for, like, for example, it needs to be a pointer, it needs to point to a data structure that is a valid string: things like that, which works surprisingly well. I didn’t expect that, to be honest, but with those kind of rules, just applying 7, 8 of those rules and you have a pretty stable heuristic for an offset.
Then, of course, an improvement to the pattern scans is emulation. So, you just need to find a function and you can emulate that function. And in the best case, you will get the offset that you’re looking for.
Then we’ve also heard today before that machine learning can help in certain cases to identify the layout of data structures. And in our case, we, of course, don’t have the ability to do live forensics…or have a live image that we can manipulate data in to our needs. We just get a memory snapshot and we need to make sense of it.
So, I will just give you a brief overview on what we did so far. So, here we do have a memory snapshot or an analyzed memory snapshot from IBM. I’ve started a process there. (I can show you in a second.)
So, there is a process called “heap_test” started by PowerShell, and it does have four heaps, so we detect the heaps first. And we also parse the allocations on the heap, as I mentioned before. So, we do parse the NT heap and we get all the allocations on the heap.
With those allocations, we can now take a look at them and scan for pointers, or in general, just scan the whole stack, the whole heap data structure…heaps…so there are…(let me take a look at the memory regions. Sort for type.) There are multiple heaps in here, a stack. The files are not really interesting and the sharedLibraries may be interesting, the unknowns, we will just strip them out.
So we can scan for all pointers in those three different types, as we may have global symbols in the sharedLibraries. And then we can further identify the allocations. There might be pointers in the middle of the allocation so that we have an indication of maybe double link lists and see they may not point to the begin of the structure that we are looking at, but in the middle.
That’s pretty common in the kernels. And we may find if we are really lucky, we may find allocations with our TTI information, or virtual function tables to begin with. And if we are really lucky, then find our TTI information on those classes. So we…and associate the pointers to those allocations as x-refs, so we can directly see, “okay, there are references to those to those class instances”, and we can just fill them in and get more information about that.
So in this case I’ve written a small test program. This is basically my own very, very tiny game engine with 200 lines of code. So, we have teams (as you can see here), player, we have weapons, objects, and they are allocated on the heap and they do have that virtual function table.
And as this is not a very nice way of visualizing that data, I’ve started implementing a graph for that, so we can see there are objects with an address and that are of the type visualized here. So, you can see, “okay, we have two objects in the game, three players, one team and six weapons.”
So, unfortunately we don’t have the x-refs visualized here yet, but once we have, you will directly see from that graph that the players have references to weapons. And each player has three references to a weapon, but two references to one of the weapons which then indicates, “okay there is…there might be two pointers indicating that there is a primary and secondary weapon, and the third pointer shows (or indicates) the current weapon the player has selected.”
With a team, we do have a problem here. I did not check yet what the problem is because there should be two teams. But apart from that, this already looks pretty good.
And yeah, as I said, with more references between the artifacts, we will also gain a way better and quicker insight into what’s going on there. We will also add, in the future, references from the stack, for example so there is another object missing here, which is the world. The world is on the stack. So we can’t see it here because those are only the allocation ones and the stack is not yet an allocation, so it’s not scanned in our data structures.
So…and we need to add that. We’ve tried to add all those references in the beginning, but it was pretty overwhelming. There were, I think, around 800,000…or up to 800,000 pointers per application. And trust me, you don’t want to wait that long until they’re inserted into the database. So, we stripped it down to the bare minimum.
And yeah this is basically the current state and we also want to achieve that we get those information from kernel allocations. So, not only from the NT heap, but also from pool information or pool allocations (the small…the big allocations of the kernel). They also indicate the type.
So there is (we can take a look at that here). We have “WindowsKernelObjectType”. There are several of those types and they also have a pool tag and an index, and we can look those up in the pool tags and the pool allocation headers. So there’s also the index to the type. So, we can try to auto match an object type just by examining the pool allocations and make sense of it without knowing the data structure before.
So in…for a process, I mean, that’s already in the product (also in other products), but for other other types and how they are interconnected just getting that mesh of pointers visualized is what we think will really bring value into reverse engineering, not only heap data or Userland heap structures, but also kernelland heap structures.
And yeah, that’s pretty much it for now. I hope you liked it, even though it was pretty early, pretty such, and yeah. Thank you for your attention. I’m open to questions.
Session Chair: Yes. Thank you very much. So, again, I’m looking around to see if there are any questions right here. No, there aren’t. Any in the chat? No, they’re not. So, I got a question for you. So, what interests me right now is: have you used this approach, like, on any application so far to extract some forensic evidence, or is that yet to come?
Chris: Yeah, so we started taking a look at that with very basic things like Notepad, and what we were able to get is yeah, the text that is in Notepad, visible, written at the moment. And that is a pretty simple pattern to detect.
So you get an allocation that contains text (or UTF 16 encoded text), and it has one reference, and then you will only get that one single result with the actual text of Notepad at the moment. So this was the first proof of concept that we did which worked pretty well. And yeah, I think that’s also version stable from one Notepad version to the next.
And yeah, we just started with some students to work on browser artifacts. And one of the really interesting projects that I’m looking forward to is information from TOR, so that you get the routing information from the TOR memory, and also potentially the domains, the onion domains, that you are connected to at the moment.
Session Chair: Okay. Sounds like a plan. Great. Thank you very much. If there are no other questions? No, there are not. Yeah. Thank you again.


